A Housing Led Recession. Four Key Indicators Showing that this Recession will be Led by Housing.
- 3 Comment
There are many factors at work here. Yet as much as the government wants to avoid a recession these are simply normal healthy signs of a system trying to revert to sustainable growth measures. Like a wildfire in the forest, this is intended to wipe out all the excess money. Each time the Fed tries to insert liquidity into the market it is only propping up and giving more ammunition to the purveyors of the current credit excess. The recession will be led by housing and all indicators are still pointing to this. Let us look at four factors that show us that housing is no longer sustaining the economy.
#1 Housing Permits
*source: Census.gov
As you can see from the above chart, housing permits have been steadily decreasing since April of 2006. These are great leading indicators letting us know where housing is heading. We are still at a very high rate of housing starts so we are simply returning to more stable numbers. You need to remember that behind these numbers, there is an entire industry catering to housing and housing related services so what this means is large contractions in the industry.
What this means to you? Expect to see declines in builders as current market excess is washed out.
#2 Homeownership Rates
*source: Census.gov
Home ownership rates have also started to decline with the rise in foreclosures. Historically homeownership rates have oscillated between 62 and 65 percent nationwide. We peaked in 2005 reaching a 70 percent homeownership rate. Of course much of this large jump was on the backs of people being put into dangerous mortgage products that they had no way of paying off. We are now back down to 68 percent and the trend is lowering.
What this means to you? Look for the trend to revert to historical means and expect a 66 to 67 percent homeownership rate in the future. This could even drop lower in the short term since many foreclosures are currently hitting the market with projects coming online.
#3 New Home Sales
*source: Census.gov
What you see is a clear signal of the peak. 2005 is the clear peak for new home sales while 2006 was the peak for housing permits. This demonstrates the art of picking peaks. Why is there a year discrepancy? First, the peak in 2005 new home sales gave the impression that we still had room to run so builders sought to meet this demand by building more homes. They were behind the curve by one year trying to meet the demands of peak 2005 which of course overstated their estimates now creating a glut of new homes competing with an already saturated market. New home sales have almost dropped in half since their peak in 2005.
What this means to you? Look for inventory to increase as sales decline and new homes keep hitting the market through projects being completed. This will compete also with rising foreclosures so ultimately this means a continuation in prices dropping. Supply is outstripping demand at the moment and until this trend reverses, you can expect much of the same.
#4 Construction Spending
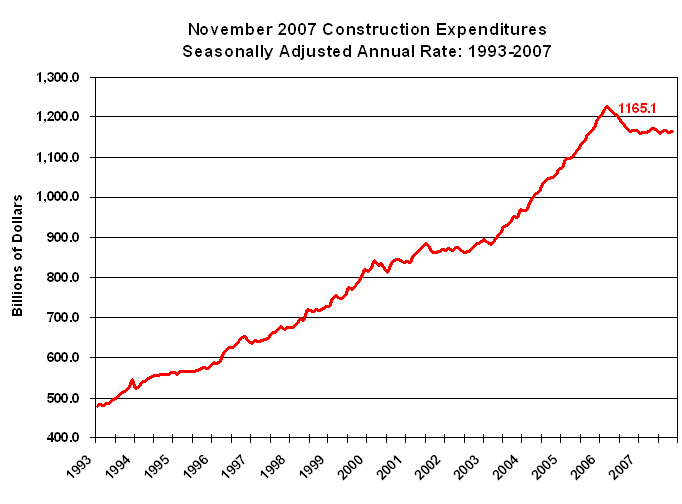
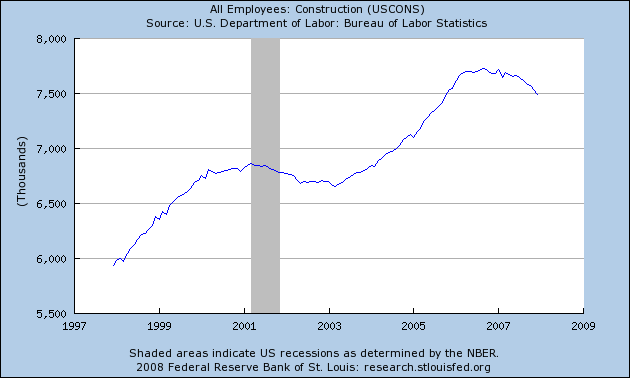
A couple of charts above. First we have construction spending tapering off hitting a peak in 2006. With over $1.2 trillion in construction spending, even a small decrease means a reduction of $55 billion in one year. Keep in mind that the peak as we mentioned in our previous chart of housing starts showed the peak in the middle of 2006 so we are only starting to see the trend starting to emerge. The next chart, shows the amount of construction jobs. This is a large number and big segment of the economy. We had a peak in September of 2006 with 7,725,000 jobs in the sector and now currently we are at 7,489,000, a decline of 236,000 jobs.
What this means to you? Look for more declines in construction jobs as permits drop and the current housing inventory is washed out. This will take a few years since we had an unprecedented boom. Invest wisely and keep these things in mind if you are planning in going into REITs or have a heavy portfolio allocation to housing related fields.
 If you enjoyed this post click here to subscribe to a complete feed and stay up to date with today’s challenging market!
3 Comments on this post
Trackbacks
-
Money Market Account Rates said:
I was researching the same thing when I saw this.. I can not agree more – but I am still going to look for a better source
February 22nd, 2008 at 8:37 am -
williamgeorge said:
Economic statistics work for us like the whiskers on a cat. As we move into the unknown future, they hint at what lies ahead. Almost all US economic numbers have decelerated over the past 2 or 3 quarters. This is a clear warning signal, but useful only if people act on it. Build savings. Be careful when starting new projects or switching jobs. Carefully watch the risk in their households’ balance sheets.
——————
williamgeorge
Search Engine OptimizationOctober 4th, 2008 at 12:44 am
[…] investing styles are going to be proven extremely wrong in 2008 and if you want any more proof, just look at these scary charts. Be wise and don’t follow the advice of the […]