Housing Market: Case-Shiller 10 City Index Worst Drop Since 1987.
- 0 Comments
The Case-Shiller Index, which tracks same home sales over a period of time instead of aggregate median prices per month, has dropped nearly 10.7 percent on a year over year basis.  Most analyst favor the Case-Shiller Index because it looks at a single home and tracks it historically over time giving a better and more reliable indicator of the health of a home’s value.  The drop is the largest drop ever experienced by the 20 city index since its inception in 2000. The index also tracks a 10 city index which dropped an astounding 11.4 percent which is a record drop since data started being tracked in 1987.Nearly all cities in the index reported losses. Here is a brief list of some of the year over year drops:
Miami:Â Â Â Â Â Â Â Â Â Â Â 19.3%
Las Vegas:Â Â Â Â 19.3%
Phoenix:Â Â Â Â Â Â Â Â 18.2%
Los Angeles:Â 16.5%
San Diego:Â Â Â Â Â 16.7%
Tampa:Â Â Â Â Â Â Â Â Â Â 15%
The only area in the entire index that reported a gain was Charlotte North Carolina coming in at a positive 1.8%.  Otherwise, across the board the housing decline is accelerating and picking up steam.  Keep in mind that we are still experiencing record mortgage resets and excess inventory. It is looking more and more that we are going to hit analyst predictions of 20 to 30 percent national median price drops once the housing market bottoms out. Let us look at the rate reset chart:
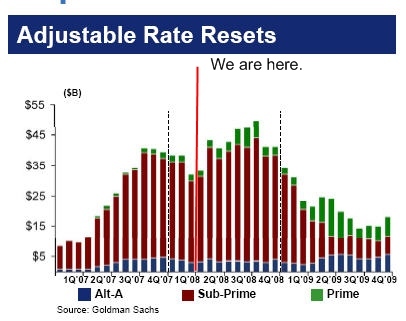
As you can see from the above chart, we still have many more subprime loans to reset which will only increase pressure on prices and also, the excess inventory by builders is again forcing them to cut and slash prices.  We’ve never had a run up in real estate as we have witnessed and at the same time, we have not seen a correction take speed this quickly either.  No one really predicted housing would go up as quickly as it did so to assume analyst can predict and exact bottom is presumptuous at best.  We can very likely overshoot on the downside just like we went into price ranges never before seen. Let us look at the graph for the 20 city index:
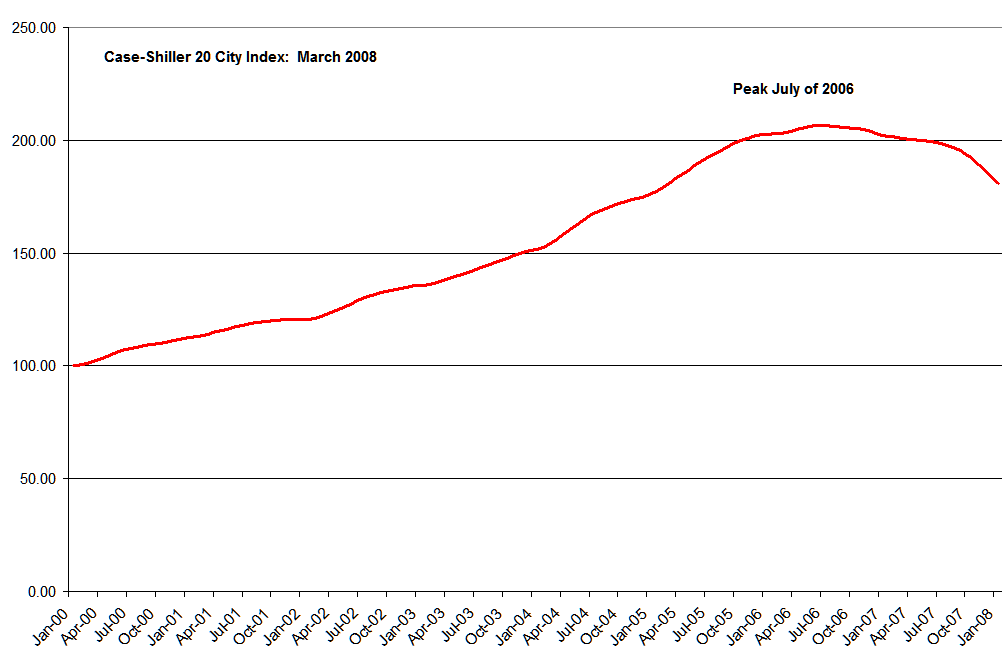
The peak was reached in July of 2006 and we are now off by 12.5 percent from the peak. Yet the acceleration is picking up. For example, with the current data we see for the last month we saw a 2.35 percent drop from the previous month. Clearly at this rate, we are going to see a 20 to 30 percent drop by the end of this year which I really don’t see. I do see continued drops but at a more moderate pace reaching bottom in 2009 and 2010 nationally.
If you enjoyed this post click here to subscribe to a complete feed and stay up to date with today’s challenging market! If you enjoyed this post click here to subscribe to a complete feed and stay up to date with today’s challenging market!