Home is where the working and middle class lose their money – $6.3 trillion lost in household real estate values. Top 1 percent control $13 trillion in financial assets while bottom 80 percent control $2 trillion.
- 1 Comment
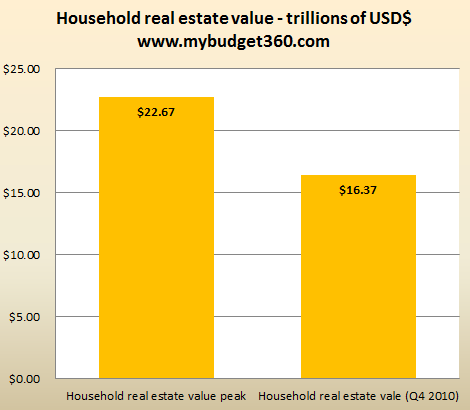
When people talk about the American Dream it usually implies owning a home. Owning a home has been part of our collective psychology for generations and is hard to shake out even after such a disastrous and financially painful bubble that will linger with us for many years going forward. After World War II, owning a home merely required one blue collar income and a desire to work hard (at times even a modest effort at work was enough). After the 1970s it meant two working adults to pull off the middle class dream. By the late 1990s stagnant income growth meant American households needed two working professionals, mortgages with mythology like leverage, and then finally access to the American potential of homeownership was feasible. But really what has occurred over these last few decades is the erosion of the middle class lifestyle and a financialization vacuum that has sucked real wealth straight up to the top. The pretense was held together with scotch tape thanks to the massive amount of debt taken by individuals and also our debt happy nation. In a world of peak everything it seems that we have reached peak debt. The Federal Reserve just released their Flow of Funds Report and U.S. households have lost $6.3 trillion in real estate wealth from the peak. The dream apparently is over and it is time to face reality.
Middle class households hold most of their wealth in their home
Source:Â Federal Reserve
At the peak of the housing bubble the homeownership rate was close to 70 percent. Psychologically people were telling themselves that they should feel wealthy since they reached the proverbial middle class but many realized it was unsustainable given the massive amounts of debt. The monthly mortgage, student loan, car lease, and credit card payments reminded people that what they currently had was all one missed payment from being yanked. The future income gains never materialized and housing prices obviously do not go up in perpetuity. Debt piled on debt like IHOP pancakes seemed to be a remedy for a few years. Households pulled money from credit cards and refinanced in record numbers spending this illusory money. As the expert of Ponzi Schemes Bernard Madoff recently said the biggest Ponzi Scheme is the American government (aka Wall Street lawmakers). In a debt society the American Dream became the American Debtor Machine. Everything was built on a façade and it was bound to fall apart and cascade into other areas of the economy like dominoes.
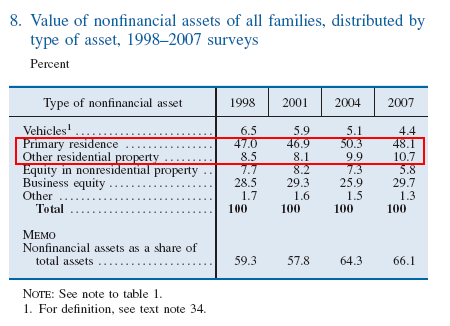
For most middle class families real estate equity is their biggest line item to their net worth statement:
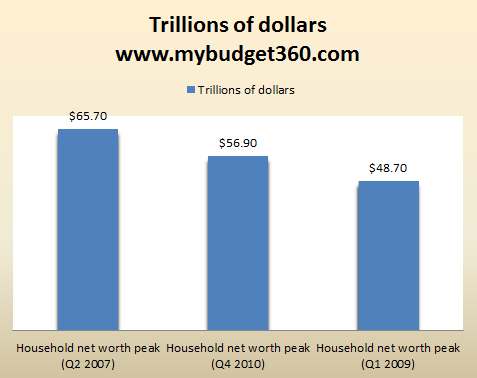
66 percent of the net worth of most American families comes from non-financial assets and 60 percent of that is real estate. So that evaporation of $6.3 trillion hits squarely on the jaw of the working and middle class. But when we do the math, the top 1 percent own over 40 percent of all financial wealth in the country and their primary residence is only a tiny part of their overall portfolio. That is why the below chart requires extensive caveats:
Source:Â Federal Reserve
Do the math here:
$48.7 trillion – $16.37 trillion      =            $32.33 trillion household net worth (excluding real estate)
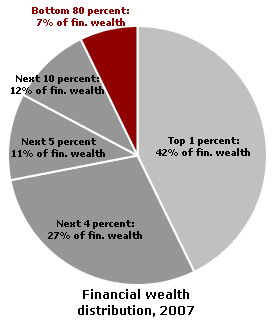
Household net worth overall is largely pulled from financial assets yet 66 percent of the net worth of most American families comes from real estate. What does this mean? The top income brackets are less hurt from real estate and benefit more from the Wall Street rally. Goldman Sachs is rallying while your neighbor receives a notice of default on their underwater McMansion. This is really no surprise when you break the figures down:
Source:Â William Domhoff
The bottom 80 percent only have a tiny piece of the financial wealth. So let us break down the actual figure since the above data includes all U.S. households:
$32.33 trillion in financial assets for U.S. households    X  7 percent        =    $2.26 trillion
80 percent of all U.S. households hold $2.26 trillion while the top 20 percent hold $30.07 trillion. Keep this in mind when you hear some talking heads talk about being broke. The top 1 percent control $13.57 trillion or 6 times the amount of the bottom 80 percent. This actually makes sense given that 1 out of 3 Americans have absolutely no savings or retirement funds. Most of this group is betting on Social Security or simply has no money left over to save each month. The average income per person is $25,000 in this country so after rising food, energy, college, and medical care costs it is understandable why so many people have no savings or retirement account. 44 million Americans are on food assistance so I doubt these people are thinking about diversifying their 401k or figuring out ways to use an LLC to hide income.
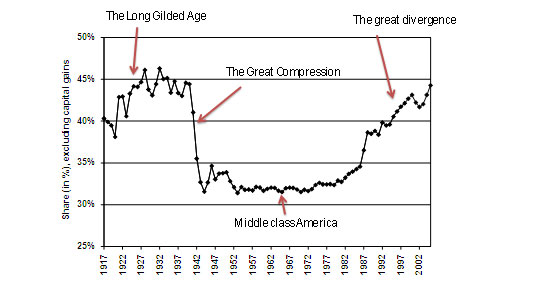
This kind of inequality is rare and the last time we saw this kind of wealth inequality divergence we ended up in the Great Depression:
Source:Â Marginal Revolution
It has only gotten worse since this chart doesn’t include the Great Recession. Part of these new figures from the Federal Reserve show us that most American families are still feeling the deep impact of the great debt bubble. However this pain is not being felt evenly and families in the top 1 percent are actually doing fairly well in this climate. The stock market is up 100 percent from the March 2009 lows so that clearly had an impact on their net worth bottom line. But again, for the majority of American households real estate is where the net worth figure really takes a jump or dive. Most Americans also derive most of their monthly cash stream from an actual job and not economic rents.
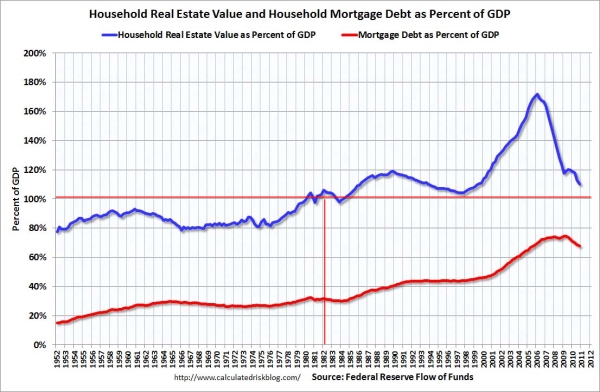
The middle class and nation relied too heavily on housing to keep the illusion going for an extra decade but really this disconnect started in the 1980s:
Source:Â Calculated Risk
From 1952 to 1980 total household real estate value did not pass our total GDP. This makes sense since you would expect that we should be producing more than what our housing is valued at. All of this changed in the 1980s. All of a sudden housing values were larger than our GDP and this was the early seed of the Great American financialization era. This charade peaked in 2006 at a whopping 160 percent. Today we are still solidly over 100 percent but when all is said and done we will likely hit the 100 percent figure. Housing is still taking it on the chin while Wall Street is up 100 percent from the 2009 lows. Guess who benefitted the most from all those bailouts?
If you enjoyed this post click here to subscribe to a complete feed and stay up to date with today’s challenging market!1 Comments on this post
Trackbacks
-
mile said:
health care is disease management for profits…cures lose the drug companys, hospitals, and doctors money…thereby disease maintence is all that is taught by the profiteers, at 25 percent of the economy………………
March 16th, 2011 at 10:20 am
 If you enjoyed this post click here to subscribe to a complete feed and stay up to date with today’s challenging market!