Housing Bottom: Futures Market Puts a Bottom at May 2010 Nationally. 17% More to go.
- 0 Comments
The idea of a housing bottom is intriguing. First, we need to put the entire housing rise to fame in perspective. Housing has never declined on a year over year basis since the Great Depression (that is until this current housing market). That is an astonishing accomplishment in itself and it is easy to understand why many wrestle with the idea that housing simply cannot go down for a long duration of time. It is also the case that this mental archetype which is so ingrained in the psyche of the American public is creating a desire for finality or a bottom to the current housing problems.
It is understandable that a generation that has never seen home prices on a nationwide scale fall on a year over year basis feels that what is going on is simply an anomaly. A Black Swan event in a orderly and efficient market world. The Case-Shiller Index has been tracking a composite of 10 large metropolitan areas since 1987. This has come to serve as the de facto rubric of measuring housing price declines since it looks at same home sales over time as opposed to looking at sales of many different homes in one given month.
There are futures traded that are derived from the Case-Shiller data. This makes it useful to look at what people are speculating future prices will be. Like the stock market, even though it isn’t always accurate at least at any given time you can determine the “market” price of a company. The futures are sold and have contracts up until November of 2012. I went ahead and compiled the data into a chart to give you a picture of whether futures traders see a housing bottom:
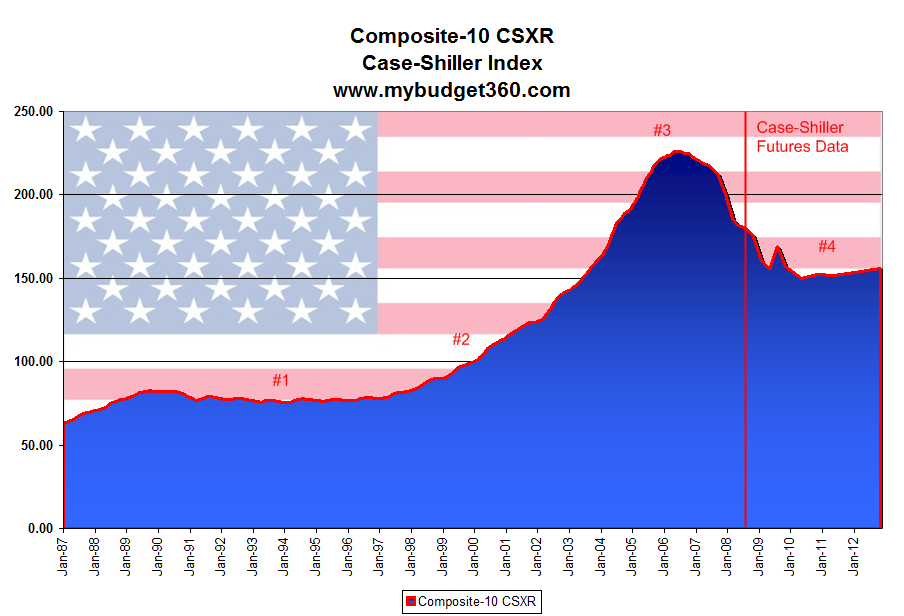
There are 4 points on the chart that I want to draw your attention to. I’ll try to summarize as best as I can what occurred during these periods.
Period #1 – 1987 – 1997:Â The boring years
During this time housing on a national level simply kept pace with inflation. In fact, prices over this decade long period were woefully underperforming. Now you may be saying to yourself that during the decade, there was no home speculation and people were simply more restrained in their risk taking. All we need to look at is the massive speculation that occurred in the technology bubble which engulfed the nation during the 1990s. People were making 30, 40, and even 50 percent year over year gains so the desire to speculate in housing wasn’t even an idea born in the minds of many. Sure, you had your real estate moguls out there but this was by far a small subset of the population. Exotic mortgages made a tiny nearly insignificant portion of the market and housing was truly viewed as simply a place to live.
Period #2 – 1998 – 2006:Â The speculative boom fever
After the technology bubble burst in the early part of the decade, the economy entered into a recession. Normally housing during recessionary times contracts because people pullback in their demand for housing if they feel the economic situation isn’t positive. This time it did not occur. Now there are a variety of reasons why housing took off during this decade:
(a):Â Negative rates:Â The Federal Reserve dropping rates to historic lows thus fueling easy credit.
(b): New exotic mortgages: Provided maximum leverage to new home buyers. Subprime, interest only, and option ARM mortgages made there way into the market.
(c):Â Chasing higher yields:Â Hungry for higher yields, foreign investors ate up these bonds and thus provided further liquidity to the market
(d):Â The housing history novel:Â Housing never had fallen before so why would it fall now?
These and other forces combined to create one of the biggest speculative bubbles in the history of the United States. At the peak it was estimated that residential housing wealth hit $24 trillion. This indeed was a good time. New products fueled a new wealth renaissance with people having the ability to tap into their mortgage equity and it would appear that consumers had found El Dorado. This in turn fueled the consumer economy since people feeling wealthier and having access to credit spent in droves.
Period #3 – 2006 – 2007 (The Peak):Â Doubt creeps into the market
The peak hit in 2006. When the peak hit leading indicators such as home sales started to decline and prices started to slow down in growth. The reason housing has reverted so quickly is the magnitude of the increase was predicated on continually having high rates of growth. This was unfeasible. The slightest decline and that was it for the housing market. This setoff a chain reaction that we are now enduring.
During the peak years which I would say were 2006 and 2007, there was a riff growing in the economy. Things were apparently getting worse yet there was still a desire to keep the existing paradigm going. Easy lending was still prominent yet cracks in the foundation were forming.
Things radically changed in August of 2007.
Period #4 – 2007 – present/future:Â The bubble is pricked
The credit crisis for a large part of society came as an utter shock. The idea that credit would become restrictive was something many did not anticipate. People grew accustomed to the idea that their homes were going up in value each year. Homes do fall in price however. This lesson was painfully learned and many realized that prices can and will go down. In fact, from the $24 trillion peak current estimates put residential housing values at $19 to $20 trillion. That is, $4 to $5 trillion in home equity has evaporated in the last two years. This is a painful realization for many. Given that the futures market is predicting a bottom in May of 2010 with an additional decrease of 17.3% from current levels we are looking at another $3.287 to $3.46 trillion in housing equity to disappear. This isn’t to account for the already $500 billion in credit related write-downs.
For those looking for a bottom the good news is that there is one on the map. The only problem however is that it is two years away and will include additional pain. We are only half way through this housing correction if the futures market is correct.
If you enjoyed this post click here to subscribe to a complete feed and stay up to date with today’s challenging market! If you enjoyed this post click here to subscribe to a complete feed and stay up to date with today’s challenging market!