S&P 500 is The New Bubble: Current S&P 500 Value is Betting on Return to Bubble Peak, Housing Mania, and 4 Percent Unemployment.
- 2 Comment
One question that seems to pop up every so often is whether the S&P 500 is overvalued. To put it simply, it is hyper-valued. From the 666 low reached in March the index has rallied 57 percent. Unfortunately much of the rally is based on temporary government stimulus, the U.S. Treasury and Federal Reserve trashing the dollar, one-time inventory gains, cash for clunkers, $8,000 tax credits for home buyers, and artificial stimulus. These are not the things that makes for sustainable recoveries. This is like running wind sprints on mile 6 of a marathon. We have a long way to go to get out of this mess.
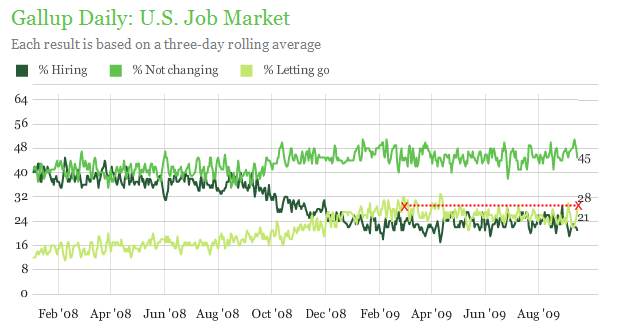
On the unemployment front, the rally is being bolstered by “slower job losses.” However, since the rally took off we have lost over 2 million jobs showing up the entire 2001 recession. In total, we have 26.3 million unemployed and underemployed Americans. Many of those that are working are seeing wage cuts or stagnant wages. And on the hiring front, we are at lows that were reached in March:
Source:Â Gallup
There is little good news here. Although job cuts might have come down from the 741,000 in January who really expected cuts to stay at that level? At that rate, we would have lost nearly 9 million jobs in one year. That was clearly unsustainable. But even the current 216,000 job cuts in August put us at a rate of 2.5 million job losses a year. The market is rallying as if this is good. It is also ignoring that hiring figure and assuming that somehow jobs will come out of some new field (or maybe from finance and real estate as bulls would hope). From what industry? That is the real question.
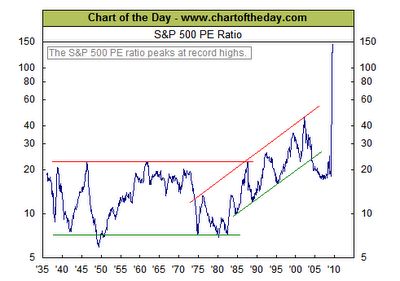
The P/E ratio based on operating and reported earnings is all fantasy. Take a look at this chart:
Source:Â Chart of the Day
Now this chart is based on the current quarter and most analysts look forward in coming up with an accurate figure. Bulls on the street are obsessed with operating earnings because this is where you can fudge the data and it is always higher than actual reported earnings. For example, with the $3.5 trillion commercial real estate bust coming many financial institutions currently have these properties on their balance sheets at peak values! These companies know full well that an avalanche is heading their way but they’ll milk the accounting as much as possible. Why else would they be developing clandestine pre-emptive bailout plans if all was well?
If you look at the past 75 years of data, market peaks were hit at a P/E of roughly 20 times reported earnings and troughs occurred at about 10. With the mania we hit a peak of 40. The current P/E is off the chart because of the weak quarter. So think about this for a few minutes. This is the worst recession since the Great Depression. You would think that a P/E would reflect this actual fact. Not the case. That is why the P/E is blowing right through the chart.
Just run the numbers for Q2 of 2009. With 99 percent of S&P 500 companies reporting earnings the earnings per share is $13.51. That would put the current P/E at $77. That is insanity. If we were at even the previous bubble averages of a P/E of 20, the current S&P should be at 270. Now this is merely an observation. Most market bulls will point to future projected operating earnings which are glossed over with onetime gains and other gimmicks. If you want to believe in a P/E of 20 then you need to believe that somehow, we are going to get $50+ per share earnings in the next quarter. And 20 is a historically high P/E ratio. And these are some of the kinds of earnings folks are projecting even though the consumer (aka the American worker) is losing their consumption power. Keep in mind that many of the short-term operating earnings are going to be based on these onetime injections. To expect them going forward is to believe in the reemergence of the bubble economy.
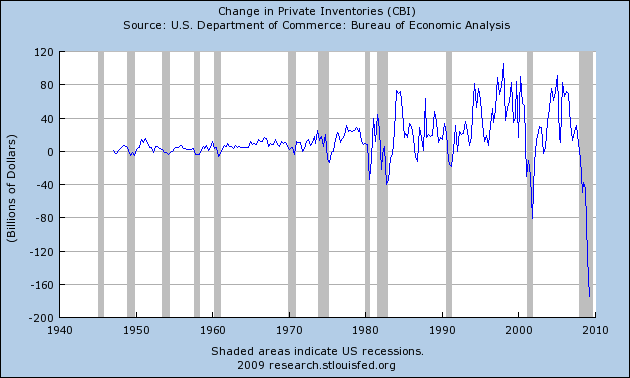
Take a look at the contraction in private inventory:
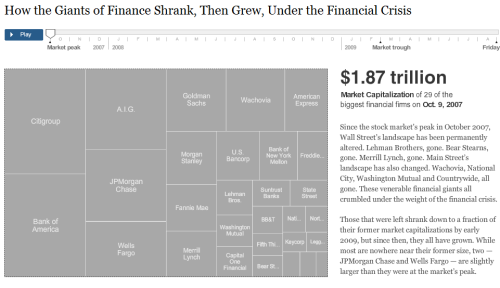
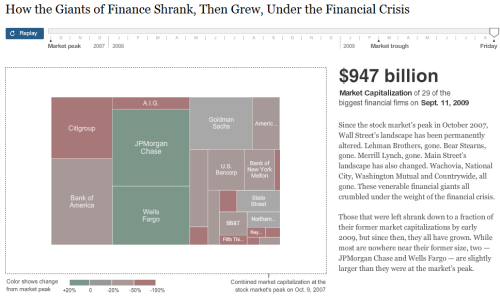
Now obviously a drop like this reflected an end of the world scenario. So much of the recent jump in activity is now reflecting this more normal pre-bubble world behavior. Yet the stock market is reflecting valuations from the bubble coming back. As usual, a bubble will end bad. And banks have been juiced to the max:
Source:Â NY Times
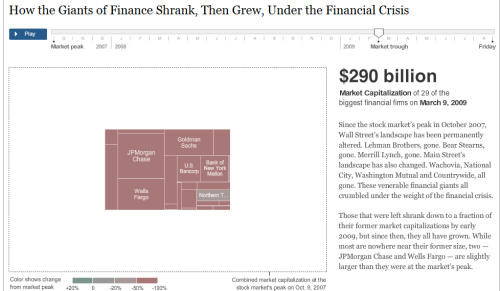
The biggest banks have regained $700 billion in market cap since the March lows. How many jobs can you get with $700 billion? Obviously zero if you’re the average American given the trend. Either way, the S&P 500 is massively over value and is predicated on the bubble coming back. That is not the case. When reality hits and those onetime fixes run out, the rug will be pulled out again. The media and pundits are claiming we are now officially out of recession. If that is the case, you can rest assured this will be a double-dip recession. That is virtually assured given these absurd valuations and putting all the money back in the casino known as Wall Street.
If you enjoyed this post click here to subscribe to a complete feed and stay up to date with today’s challenging market!2 Comments on this post
Trackbacks
-
bob said:
Yet again, thank you! The hype machine must eventually run out of manure to feed the mushrooms at the farm……………..kept in the dark and fed manure.
September 16th, 2009 at 5:26 am -
Adam Sharp said:
I recently got into discussion on market valuations with a bigshot from a top 5 investment bank. I mentioned the operating vs. real earnings issue, and he had no idea what I meant. And this guy runs a LOT of money. Told me to focus on cash-flow, not profits. HAH!
September 16th, 2009 at 11:30 am
