Southern California Home Prices at a 67 Month Low: Sales Jump Unseasonably due to Major Price Cuts.
- 1 Comment
The recent data for the Southern California housing market was released today. A pattern is starting to emerge. Low price homes are helping to increase sales and lower priced areas are also pulling the median price down for the entire region. This is symbolic of the drastic price reduction we have witnessed over the past year. Over half of the homes sold in Southern California last month were foreclosure resales. These of course will have lower prices simply because they are being sold at rock bottom prices. Lenders and banks with a large number of REOs cannot be picky if they want to move homes.
What is being spun in the media is that this was a record jump in sales. This of course is true. In percentage terms the jump is one of the largest we have seen for Southern California. First, let us take a look at the raw numbers:
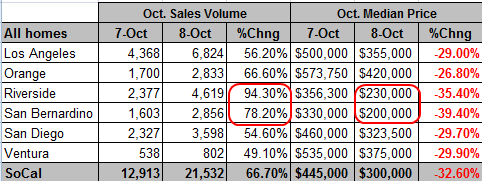
First thing you should notice is that the biggest jumps in sales occurred in the Inland Empire. What you’ll also notice is that these two counties had the lowest prices. These areas are now flirting with the $100k range which was unheard of for Southern California for many years. We will soon breach that level in the upcoming months. These areas are also the hardest hit with foreclosures.
The largest county here of course is Los Angeles. It has 10,000,000 residents and 88 cities spanning the entire spectrum of income classes. This is a good microcosm of the California housing market. This jump, although big and unseasonal is nothing out of the norm. During the fall and winter sales normally decline. This is a typical pattern. October normally starts seeing this pattern emerge. This month we had a slight jump. Yet it is important to put this into context since a massive percentage increase may seem like a big deal but it really isn’t. Let us first look at L.A. County sales history:
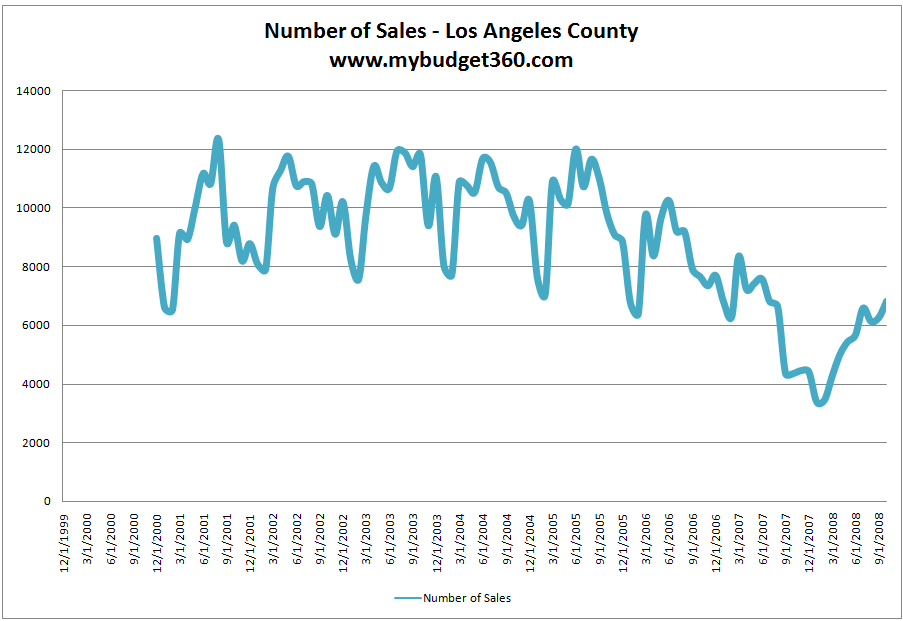
What you’ll first notice is that every fall and winter like a natural wave, sales go down following the spring and summer strong months. That is very typical even during the bubble years. The data on the chart goes back to 2000 so it encapsulates the entire bubble. So what you see is a slight jump for October for L.A. sales but is nothing even remotely close to the bubble year sales numbers. The strongest sales month was August of 2001 with 12,324. Last month L.A. had 6,824 sales. I went ahead and ran the average monthly sale for the past decade and got an average of 8,796. We are running well below strong sales numbers.
In addition, in the peak years for example, in October of 2004 we had 9,709 sales and in October of 2005 9,792. We have to put things into context here. Even October of 2001 had 9,411 sales. The 6,824 number seems extremely weak in relation to that data.
We also should take a look at the L.A. County median home price:
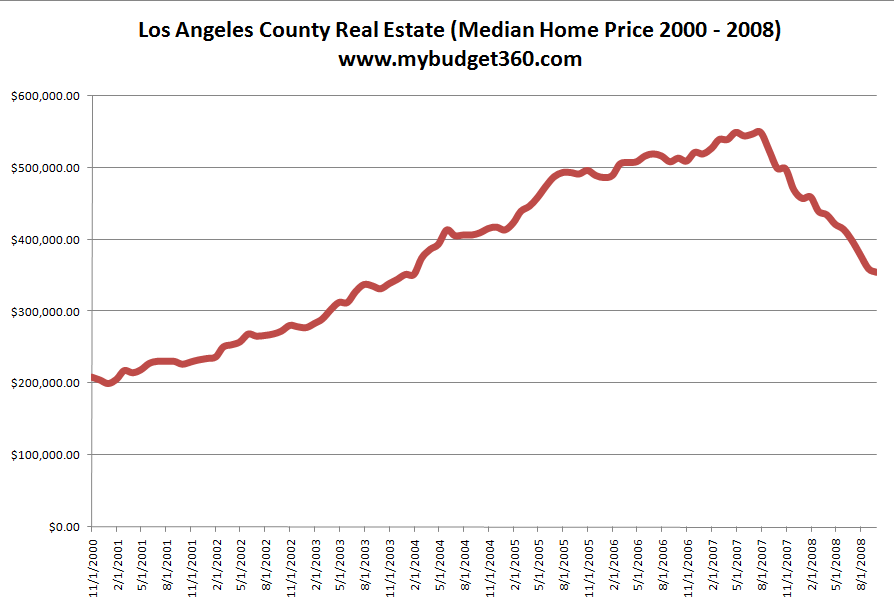
If you really want to see why sales have jumped in the last year this should explain it well. From a $550,000 peak in August of 2007 to the current median price of $355,000 people are simply reacting to market forces. A drop of nearly $200,000 in one year will get your attention. So there is another important point I would like to make. In economics price drops for the most part will always have a direct impact on supply. So for the magnitude of this price drop you would expect to see a more significant jump in sales. We did not see that. So yes, sales are starting to heat back up but for the amount of prices falling, it is not really that strong of an influence. So for a 35% price decline sales jumped 56%. If we want to get back to that average of 9,000 for October, we need sales to increase by approximately 30%. We can do a simple equation for L.A. here:
-35% price drop / +56% jump in sales = x price drop / +30% jump in sales = 18.75% additional price drop
This is a very crude way of looking at things but interestingly enough the Case-Shiller futures markets are predicting that the bottom for Los Angeles will be in 2011 with an additional 19% price decline. Things are starting to converge on all fronts.
I bring this information up because many people are on the fence about wanting to buy a home. If you are comfortable with losing approximately 20% in a home value from a purchase today then go ahead and buy. I understand there are other circumstances to buying a home aside from price. But please do not think this is a bottom for Southern California. There is a wave of foreclosures that will begin hitting in mass in 2009 much from the option ARM loans. Even with legislation trying to avert foreclosures many people are simply way over their heads and will lose their homes. Take a look at the most recent Southern California data:
Total SoCal Inventory:
125,907 for all six counties
So at that level and the 21,532 homes sold in the region last month, we have 5.8 months of inventory. Which sounds like a more even level until you look at what is coming online:
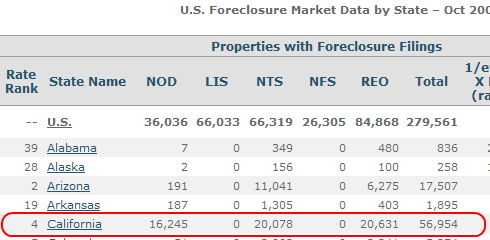
We have over 56,000 distressed properties coming online in October alone with the majority of these properties in Southern California. So what does this all mean? Expect sales to be at higher levels than last year but expect prices to continue to decline.
If you enjoyed this post click here to subscribe to a complete feed and stay up to date with today’s challenging market! If you enjoyed this post click here to subscribe to a complete feed and stay up to date with today’s challenging market!
1 Comments on this post
Trackbacks
-
Jewellery said:
Our local market is booming: west Texas, oil field, lots of technologies. My house is worth about 30% more than I paid for it just a few years ago, according to our realtor. Several people on our block (many here are retired couples who are quite mobile) have just sold to take the profits and move to a cheaper area!
March 27th, 2009 at 4:01 am