What is a Recession? California Inflation, GDP, M1 and M3, and the Art of the Federal Reserve.
- 2 Comment
CPI 1999 = 168.5
CPI 2007 = 217.4
How do we derive the current price of goods for today? We follow the following formula:
2007 Price = 1999 price X (CPI 2007 / CPI 1999)
2007 = $198,000 Southern California Median Home X (217.4 / 168.5) = $255,000
And what is the current median home price for the region? How about $425,000. Prices are currently trending lower from the $500,000 peak that was reached for the region. The question that exists for many is will prices come back down to inflation adjusted prices? That is yet to be seen but the trend is definitely pointed toward this.
Incomes not Keeping up
Why are you not feeling any richer even though you are making more money? It is the eroding nature of inflation and the fact that California is already in recession even though we do not have the official label as of yet and we will touch upon that later. Let us use the above formula again for the state and show how inflation is still eroding the purchasing power of current consumers:
2000: $47,493
2007: $54,385
CPI 2000: 174.8
CPI 2007: 217.4
2007 Income = 2000 Income X (217.4 / 174.8) = $59,067
Not a big difference but you can see that even though households bring in more than in 2000 the power of inflation has actually taken away more than $4,600 in purchasing power. The fact that housing has adjusted at a pace unseen and justified by a rise in incomes only points to the inevitable reality that prices will continue to come down further in the upcoming years.
What is a Recession?
Ronald Reagan, the once Governor of California and former President once said that “a recession is when a neighbor loses his job. Depression is when you lose yours.†This is a very accurate quote on how society perceives economic downturns and the way things are currently playing out, it seems like the economy is once again going to be the main item on the menu. The macroeconomic definition of a recession is a contraction in GDP for two consecutive quarters. Taking a look at the actual dollar amount of GDP we are still growing:
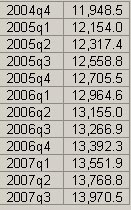
So what is all the clamoring about? Well the data is actually a lagging indicator since it takes time and 3 months worth of data to make a quarter but the trend is clear that 2007 had a slow year. It is quite possible that we are already in one quarter of declining GDP. GDP stands for gross domestic product and is a way of measuring a country’s productivity. Basically the formula is as follows:
GDP = consumption + investment + (government spending) + (exports − imports)
Now you know why the decline in retail sales was watched over so closely. Consumption is roughly 70 percent of the
Investing During Recessionary Times
Take a look at the below chart. The gray areas highlight past recessions:
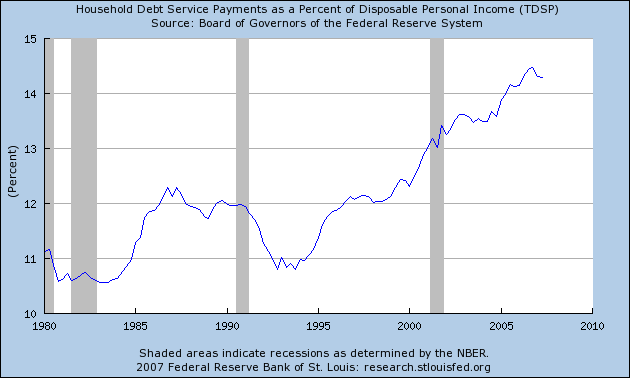
The last recession hit us in 2001 after the tech bubble burst and the attacks of 9/11. It was a double whammy that knocked this economy on its back but keep in mind we were already heading down this path. The chart above shows the amount of disposable household income that goes to servicing debt. This is a crucial chart because it shows how Americans are now becoming more and more heavily pressured by servicing their current debt out of income that would go into consumption or investment (refer back to the GDP chart above). $1 going to pay your credit card debt is $1 that you don’t spend on a widget.
These are important factors to note when planning on how to invest. We are seeing interesting things occur. Take a look at the price of oil chart:
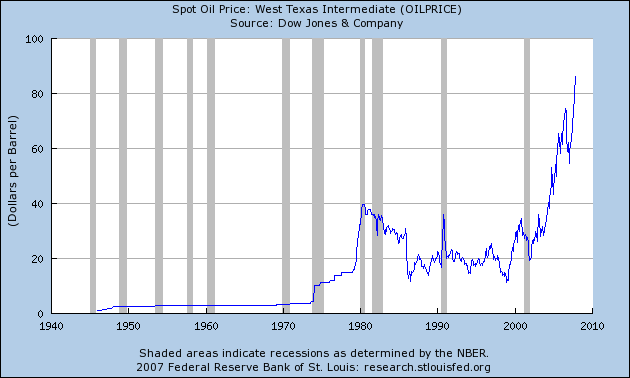
Oil has skyrocketed during this decade and this is important because it increases the cost of energy and many Americans in metro areas are dependent on energy for household needs and also automotive needs. With incomes lagging inflation and energy outpacing inflation the bottom line is households have switched to deficit spending in order to maintain their current lifestyle. Given the massive growth of
While certain areas of the economy are seeing radical price jumps we are also seeing depreciation in certain asset classes. Housing for example is trending lower across the
If we are to look at the M1 money stock chart it would seem that this area hasn’t grown that significantly:
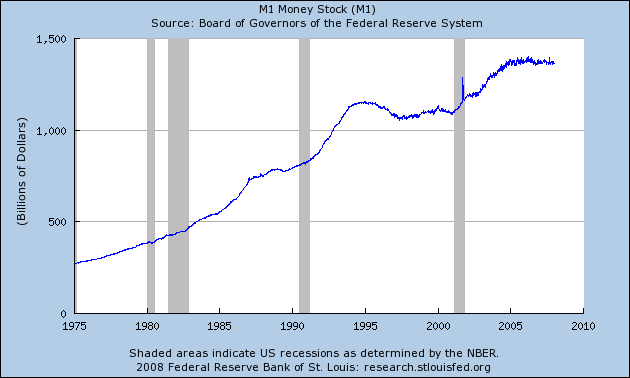
So if we are to adhere to the hard definition that inflation is the growth of the money supply we can say that there is no inflation. But this is not the case and is evident even in under reporters of inflation such as the CPI. If we are to look at the real growth of the monetary system we need to look at M3:
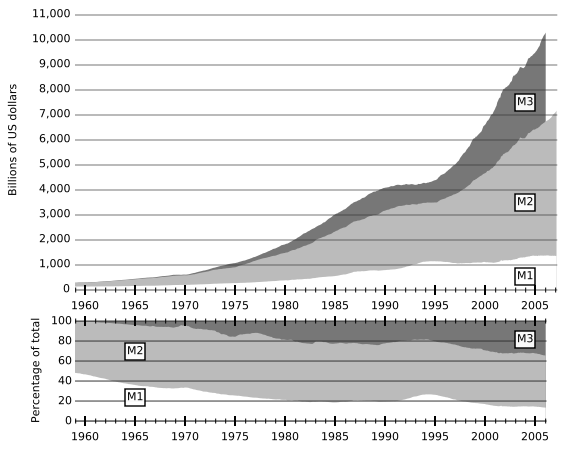
M3 which includes M1 + M2 and repurchase agreements is the place where we have seen explosive growth. This is why we have the enormous credit bubble that we are currently living in. You can almost track and pinpoint the exact moment Alan Greenspan dropped rates to 1 percent and essentially killed the US dollar and setup the
Ben Bernanke has made if very clear that he is going to chop rates even further which bodes well for: commodities, foreign currencies, and paying off debt! Believe it or not paying off debt in a deflationary environment is actually a wise investment move. It is always a wise move but when prices are declining it is important to pay off debt with current dollars since today’s dollar won’t have the same value tomorrow while your debt remains pegged. Case and point is people underwater in their mortgage. You buy a home for $500,000 that is now valued at $400,000. If your income drops from $75,000 to $70,000 because the impact of declining purchasing power, that $500,000 gets more and more expensive. Yet if we have massive wage inflation (do you see this happening?) then that $500,000 won’t look so bad if your income jumps to $200,000 and your home is now valued at $700,000.
It is important to understand the entire scope of the economy especially in a week were most major markets such as the DOW, NASDAQ, and S&P were off by approximately 5 percent. Where are you investing in 2008?
 If you enjoyed this post click here to subscribe to a complete feed and stay up to date with today’s challenging market!
2 Comments on this post
Trackbacks
-
patrick debernardi said:
can anyone tell me what the exact $ amount for the GNP and GDP
January 28th, 2008 at 7:12 pm -
R Holland said:
I believe Merrill Lynch is correct about the arrival of recession in the United States. The housing downturn is negatively impacting property sales in second home communities in Florida. This is also slowing sales in NC mountain resorts that depend on Florida buyers.
Still the downturn in prices and building of inventories is starting to attract second home buyers from Florida looking for cool temperatures in our mountains. Also the dramatic decline in the dollar combined with weakness in American real estate markets are beginning to interest some bargain hunting European investors.
Ron Holland, Broker/Realtor with Wolf’s Crossing Realty. See http://www.ronaldholland.com Ron markets resale mountain and ski resort properties in NC in Wolf Laurel and The Preserve at Wolf Laurel.
February 11th, 2008 at 10:07 am