Global Markets: World Stock Markets Feeling the Pain of the Credit and Housing Crisis.
- 1 Comment
There have been many theories floating around the financial press that the world markets are now independent and that having a global depression like times in the past was highly unlikely. For the most part, since the credit crisis took on a full head of steam in August of 2007 most world markets are falling in tandem with each other. The idea known as “decoupling” is largely untrue since each of the largest global markets based on their GDP are linked to one another. These countries trade, exchange, and interact with one another in their markets.
The challenges are also similar across these economies. Many became heavily dependent on easy access to credit and now face a market where credit standards are much tighter. It is also the case that many economies like the United States, Europe, and Australia are facing their own housing bubbles.
So how have the world stock markets performed since the credit crunch of August of 2007? We’ll be looking at a few charts to see how things are now one year into the crisis:
*Source:Â Yahoo Charts
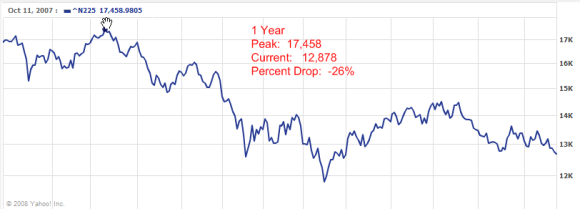
The Nikkei 225 is down 26% from its peak last year. Given that Japan is the second largest economy in the world in terms of nominal GDP, this is important to take note of. Recently we have also seen that quarterly GDP for Japan has contracted signaling that they are facing a recession.
Japan suffered one of the biggest booms and bust in the 1980s then faced a massive bust in the 1990s which is still being felt today. In fact, the Nikkei hit a peak in 1989 which has yet to be revisited:
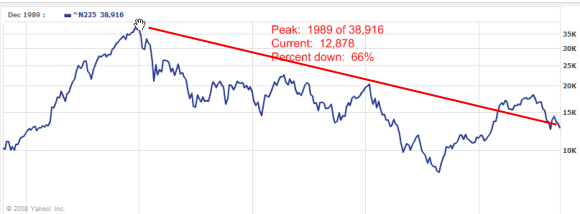
People forget that Japan had one of the largest asset bubbles ever witnessed in the financial history of the world. The fact that the Nikkei is down 66% from a peak in 1989 tells us a lot. What it tells us that it is possible for a global large economy to face stagnant growth for multiple decades. Many people have seen this chart for Japan real estate:
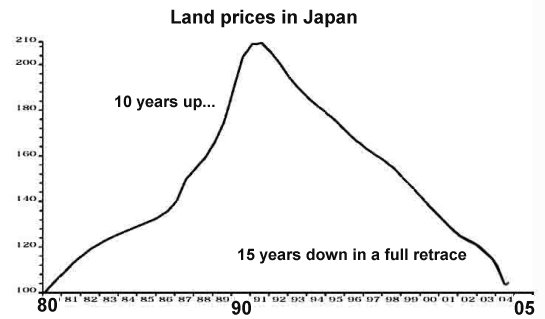
What this allows us to understand is that it is very possible that we will face the same type of scenario that Japan did. Keep in mind that the Bank of Japan lowered rates even lower than our Federal Reserve and the market still did not improve. There is nothing that lower rates can do for asset bubbles that were too large to begin with. The United States is seeing this on a massive scale but areas like California and Florida are going to see the worst of the bust given their massive increases.
The rising star economy is China yet they are not immune to the global slow down. Let us take a look at what is going on in the Hang Seng market:
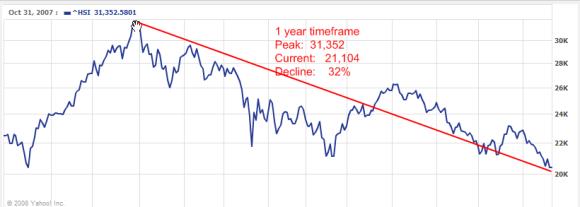
This index is setup to measure the largest companies in Hong Kong. 45 companies make up 67% of the Hang Seng Index. The HSI was started in 1969 so it does carry some historical power. As you can see from the above chart, there has been a major correction in the last year with the index being down over 33%. The index has shaved off over 10,000 since the credit crisis started.
Again, as quickly as China is growing much of the growth is dependent on exports to other nations. If these other nations are facing their own pain their isn’t enough internal demand to keep growth at current rates. Clearly they are building their own domestic markets but nothing to support what is currently being produced. That is why we are seeing a massive correction.
Let us now move on to the three major market indicators in the United States, the DOW, NASDAQ, and S&P 500.
The DOW is having some hard times given the current market climate:
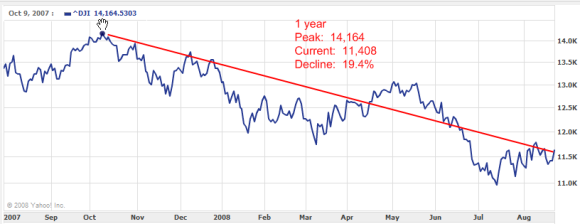
The DOW is down by 19.4% from the peak reached during the credit crisis. We’ve already trenched into bear market territory which is a technical decline of 20% from the peak price. Given the Japan and Hong Kong markets you can see that the United States index is doing a bit better.
Let us now look at the tech heavy NASDAQ:
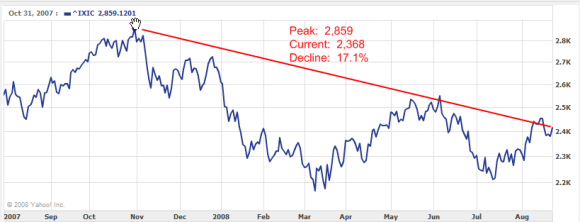
The NASDAQ, although being heavy with tech companies is down 17.1% as well. It would appear that nothing is immune from the credit crisis since much of the business infrastructure is dependent on this easy access to money.
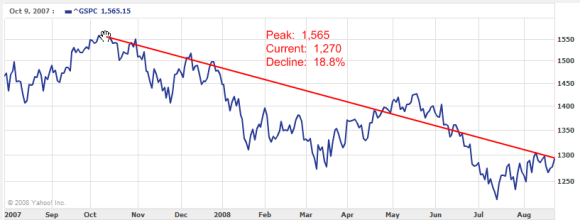
Let us take a look at a broader measure of the United States economy, the S&P 500:
Â
The S&P 500 with a broader view of the economy since it incorporates many more companies is down 18.8%. Clearly all these signs point toward a global recession. Let us take a look at few in Europe:
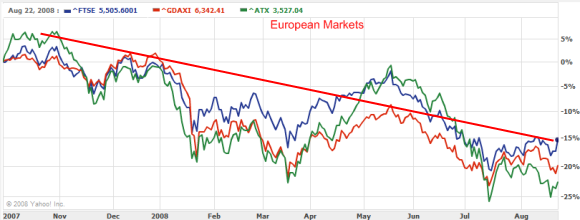
Simply by looking at these charts you’ll be hard pressed to find any large global economy in the positive since August of 2007. Â If anything the major markets throughout the world are telling us that this credit crisis is binding all of us at the hip. Â The theory of decoupling doesn’t seem to be holding during this current market turmoil.
With many of the European counties having bubbles rivaling or even larger in percentage terms than the Untied States, they are only going to face more trouble.  In fact, many of these countries such as Ireland and Spain are a few years behind the U.S. Overall, global markets are still shaky at the prospect that things will get progressively worse.
If you enjoyed this post click here to subscribe to a complete feed and stay up to date with today’s challenging market! If you enjoyed this post click here to subscribe to a complete feed and stay up to date with today’s challenging market!
1 Comments on this post
Trackbacks
-
stu mann said:
The US still has holds the ace because the US dollar is still the world’s reserve currency. I recent relative strength in the US is probably due to the Bush Admin’s pro-biz life-line to Wall St. This is only a quick fix, as the blank check to Fannie & Freddie have now pushed the US’s budget into what by 1970’s standards would be “third world”. The US budget puts you at “junk” status. Investors will eventually realize the life-line offered is no better than the worthless IOUs they now hold – and panic
global dive
August 31st, 2008 at 9:51 pm