Washington Mutual: WaMu and the $239 Billion in Outstanding Loans. $52.9 Billion in Option ARMs. Analysis for the Upcoming Year.
- 0 Comments
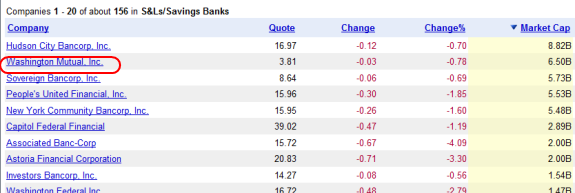
Washington Mutual has been taking a major hit with the current credit and housing crisis. Washington Mutual is down 71% on a year to date basis and with the recent announcement of a $3.3 billion quarterly loss, things will continue to be difficult. Washington Mutual is categorized under a S&L/Savings Bank and even given the current share price, is still ranked amongst the top for market cap in this category.
This is an amazing stat in itself since the institution has lost over 71% of its value in this year alone. The market has been punishing all financial institutions across the board and this reflects the widespread credit and housing problems:
Â
Washington Mutual currently has over 43,000 employees. In their recent public quarterly report, we can see in one of the attachments the break down of their loan portfolio and we can see why given the current loan distribution why Washington Mutual will potentially have a difficult time if the housing market does not improve. Just for perspective, IndyMac the recently taken over S&L/Savings Bank had assets of $32 billion. WaMu has approximately $320 billion. In this article we are going to look at the $239 billion loan portfolio of WaMu with a major focus on the Option ARM subsection. First, let us see the breakdown:
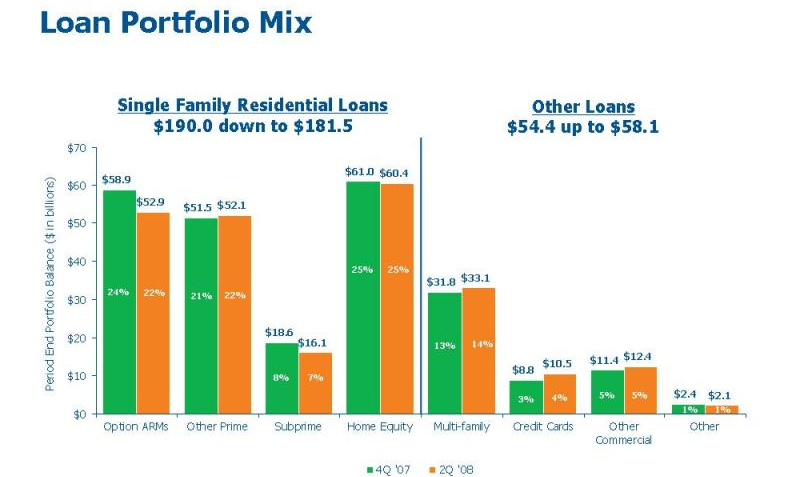
*Source:Â Edgar Online
What you’ll first notice is that WaMu holds a large amount in home equity loans. $60 billion in home equity loans is a lot and given how things are playing out in certain markets like California where WaMu has a large presence, many of these loans have made homeowners go underwater.
You will also notice $16 billion in subprime loans. With such high default rates for subprime loans this is another section that will have continued losses simply because of the overall declining housing market across the country. In addition, many subprime loans are made to borrowers who simply do not have the means to stay current and by default, subprime loans are made to those with poor to substandard credit. People get dings on their credit when they miss payments so the history is already there. Of course the past is no indicator of future behavior but it is a good indicator.
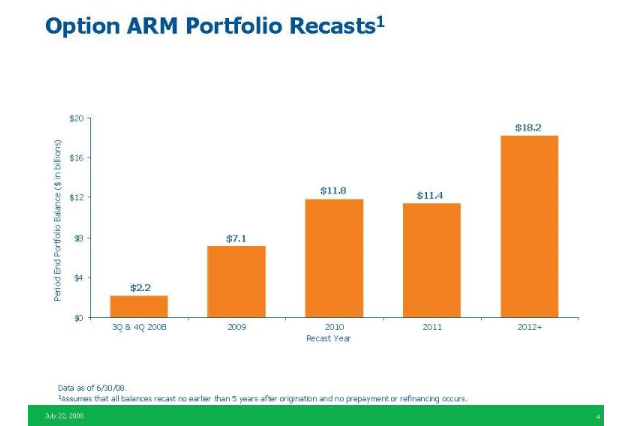
The major issue we will be seeing in the next few months is with the Option ARMs. WaMu currently has $52 billion in Option ARMs with approximately half of the loans in California. California as we recently discussed is now making up nearly 10% of all the nationwide foreclosures. The trend should continue since the recent numbers for the state show that the median price is now down by 37.7% on a year over year basis. This will prove to be problematic in the upcoming year. And just to highlight this, let us first look at the recast dates for the Option ARM portfolio:
Â
As you can see from the chart above, the major recasts won’t start until 2009 and this will remain all the way through 2012. You can see that for the third and forth quarter of this year only $2.2 billion of the Option ARMs will recast. The trouble with many of these loans is that you have the option to pay an artificially low rate for 1, 2, 3, or even 5 years and then all of a sudden be hit with a stunning rate increase. In fact, 80 percent of Option ARM borrowers in the country make only the minimum payment. This minimum payment sets up a negative amortization scenario where the actual balance of the loan increases. What this means is the borrower isn’t paying any principal down and is most likely not even covering the interest of the loan so the balance grows. There are caps for the growth and they are hitting at the worst time possible.
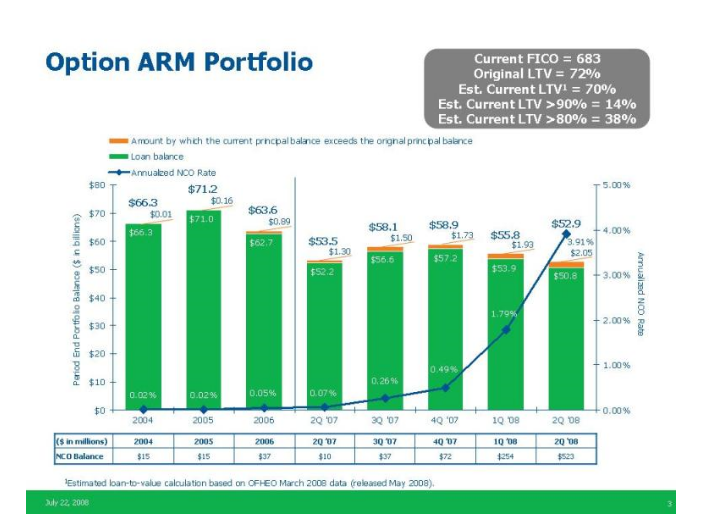
What is more troubling is that many of the Option ARMs are already seeing trouble and the bulk of the recasts are still months away:
Â
As you can see from the chart above, problems with these loans started increasing in the third quarter of 2007 when the NCO rate was 0.26%. Now, we are already up to 3.91% and as you see from the above recast chart, we haven’t even seen the start of the major recasts occurring.
What this tells us is the quickly deteriorating California market is hurting the Option ARM folder quickly. Keep in mind that at least statistically in 2007 California was still up on a year over year basis. To go from a positive to a negative 37.7% is an absolute crash and will put the portfolio in a precarious situation. Many borrowers who would like to sell their home now find that they are underwater with a market that is tanking. The assumption from many analysts that buyers would not walk away from homes was based on factors that were largely absent in these loans. That is, down payments of 10 to 20 percent on fixed rate mortgages. As the negative equity position increases, there is more incentive for the buyer to walk away and with zero down loans in many cases, that 37.7% decrease provides plenty of incentive. These loans are sure to increase the REO numbers for WaMu. Let us now look at the actual region breakdown:
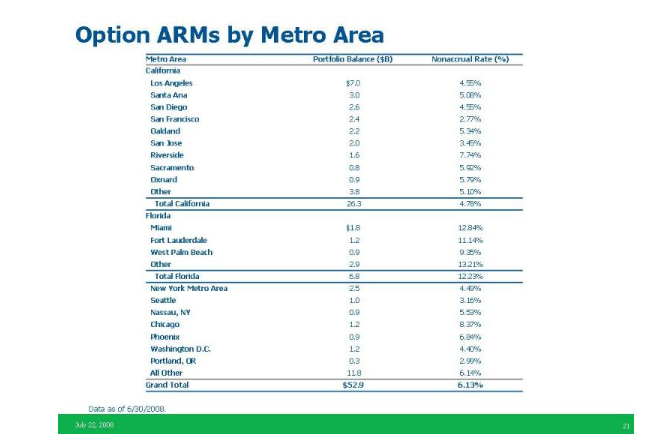
$26.3 billion of the Option ARM loans are in California. An additional $6.8 billion are in Florida. These are the hardest hit states in the entire country on a nominal basis and they compose $33.8 billion of WaMu’s Option portfolio. Given that we are extremely early in the recast period and just given the median price drop the vast majority of these loans are underwater.  Short of a boom in California and Florida housing prices these items will drag WaMu down for the foreseeable future.
If you enjoyed this post click here to subscribe to a complete feed and stay up to date with today’s challenging market! If you enjoyed this post click here to subscribe to a complete feed and stay up to date with today’s challenging market!