The largest bracket of tax payers in the United States is made up by those making $15,000 a year or less: Half of all federal taxes paid by those making $250,000 or more. Sample $50,000 budget.
- 6 Comment
New IRS tax filing data sheds an interesting light on the American economy. Americans for the most part comply with paying their taxes as measured against other countries. However, when we look at tax data we get an interesting picture on the low wage economy. As it turns out, the largest tax bracket comes in the form of those making $15,000 or less per year (this group makes up 25% of tax filings). What the data also finds is that households making $250,000 a year or more make up 2.4% of filers but pay 26% of all federal income tax. So when we hear about large spending proposals we have two ways to fund them. It means higher taxes or simply more deficit spending. We’ve already covered how inflation is really hitting the family budget even though we continue to hear stories to the contrary. Just look at the actual numbers on real life spending. The IRS data always gives us a nice look at how household spending is measuring up.
IRS tax data
Over 90 million tax returns report a household income of $50,000 per year or less. What this means is that over 60 percent of American households are reporting annual income of less than $50,000 per year. According to Census data the typical American household makes approximately $50,000 per year. Since most families are part of the two-income trap, the per worker wage of $27,000 per year makes sense.
Take a look at the IRS data below:
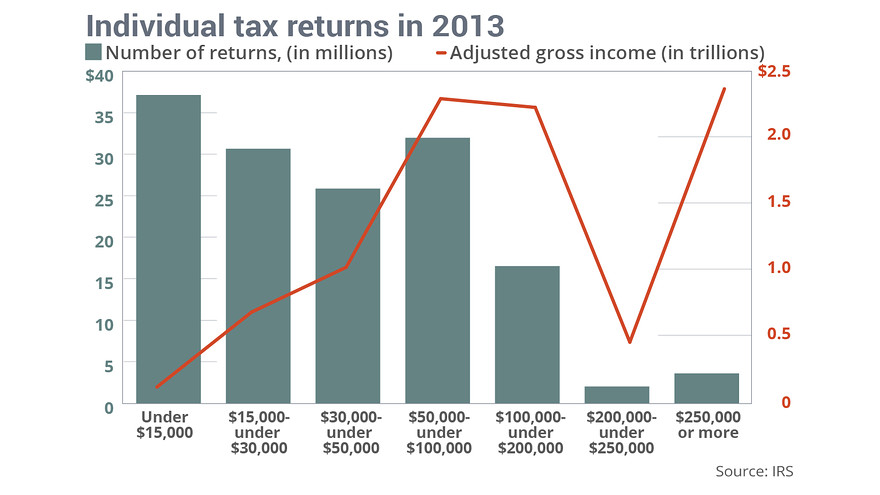
Source: IRS
The bulk of the federal income tax is paid by those making $50,000 per year to $200,000. Then you have another big chunk of taxes being paid by those making $250,000 or more. Yet this is strictly federal income tax. This fails to capture the following taxes:
-Social Security taxes
-Medicare taxes
-Sales taxes
-Property taxes
When these taxes are included, the burden is large on everyone. We can argue the merits of tax rates or the politics of paying taxes but the reality is, if we continue to run current deficits and spend as we do there will be more taxes or more debt. That is simply the reality of the situation.
Take a look at current expenses and revenues:
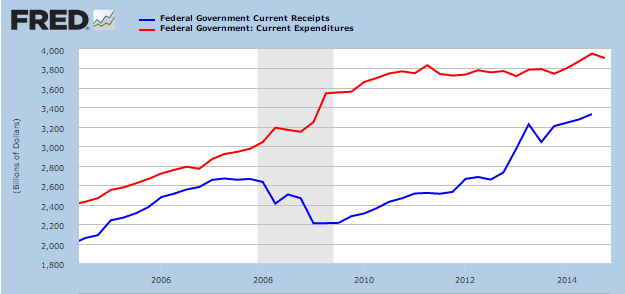
The government is spending over $3.8 trillion but brining in less than $3.4 trillion. If this was a regular household it would be digging a deeper hole each and every year. Yet the government has the ability to digitally print debt and fund its way out. However you have the slow methodical process of causing inflation to hit working class Americans which is the bulk of households based on IRS tax data.
I’ve covered budgets on households making $46,000 a year. Here is a budget for someone living in a high cost market:
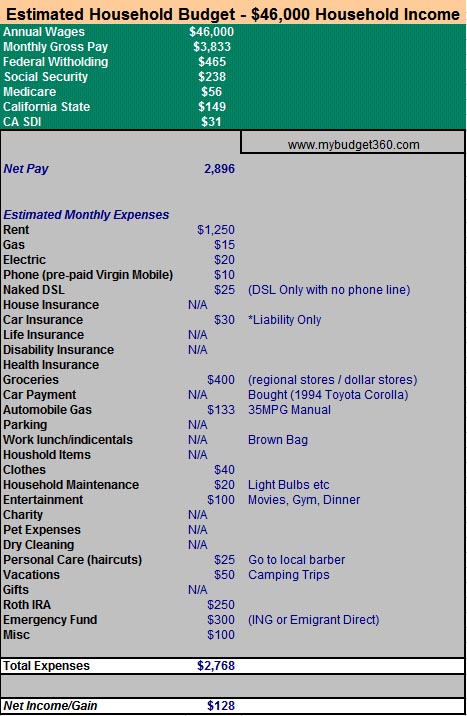
Housing is the big variable here since high cost areas will consume a sizable portion of your budget versus most of the country where real estate is reasonably priced. But with Wall Street buying up many rental properties, rents have gone up much faster than incomes.
The IRS tax data paints an interesting picture of our current economy and revenues. If we want to continue spending like we are, we will be facing higher taxes or more debt. That is just the simple math of the situation.
If you enjoyed this post click here to subscribe to a complete feed and stay up to date with today’s challenging market! If you enjoyed this post click here to subscribe to a complete feed and stay up to date with today’s challenging market!Â
If you enjoyed this post click here to subscribe to a complete feed and stay up to date with today’s challenging market! 6 Comments on this post
Trackbacks
-
william said:
The Workers provide the Bodies to fight the wars that protect the wealth of the 1%. Why are the Workers also paying for the weapons/materials? “Much is expected from those who are blessed with much”. It is far past time that the myth of cutting taxes of the Rich is intelligent. It is past time the 1% contribute ALL to the wars,as so MANY Workers have contributed ALL.
February 3rd, 2015 at 12:14 pm -
Patrick Henry 2015 said:
Who pays 20 per month for electric?!?
More like 180-250 per month!!
February 3rd, 2015 at 12:56 pm -
Dave said:
The Fix is to tax the upper bracket until they cry. It worked in the past and it’ll work again.
I do not suggest the rate increase as a punishment.
Let me repeat; I do not suggest the rate increase as a punishment.
We need the rich to be successful and we need to tax them hard.
It’s how we built this great country’s infrastructure that allowed them to be ever more successful and this country to be the envy of the world. You can not ignore history.
I suggest a minimum of 50%.
The 1%ers the ‘liquidate’ their gross value in
order to lower their tax burden. One method is to pay the workers more, thereby raising their tax burden. In effect we all pay a little more.When I offer this suggestion, the response
often is, very passionately, demanded of me is to name one country that
successfully taxed its way to prosperity.The answer?
The United States of America;
1945-1980February 4th, 2015 at 4:06 am -
Frank said:
I’m retired, with no debt, and own my home. My annual budget is $32K. The majority of which goes to taxes and insurance. Both of which go up faster than my income.
February 4th, 2015 at 8:47 am -
Toby said:
Utility bills in the example are extremely underestimated.
Roth IRA and Emergency funds allocations are essentially zero, since those funds will go to accurately estimated utilities, food, fuel, and insurances.
The median income American is losing financial ground every month…..
February 5th, 2015 at 9:39 am -
Sarah said:
Thank you for the sample budget. While I agree the gas and utilities are too low, I think the greater point of the budget is how little room there is for even the most minor financial set-back. I appreciate that you weave an emergency fund and IRA into consideration, and I’d love to find others willing to share this budget scenario for their region, too. It’s fascinating to contemplate the numbers, and how it fits into the national whole, but far less fun to live the reality of the tight budget!
February 8th, 2015 at 9:01 am