Comparing the inflated cost of living today from 1938 to 2015: US Dollar losing an enormous amount of purchasing power since 1938.
- 8 Comment
People have a hard time understanding how inflation erodes their purchasing power. Little by little the cost of everything goes up and people simply assume this is normal in an economy. The $2 movie ticket becomes a $8 movie ticket. That can of tuna just got smaller but the price remains the same. The cost of going to college went from manageable to needing large student debt merely to complete a four year degree. Inflation is argued to be a purely monetary outcome. You have too much money, in the form of cash or credit in today’s case, chasing fewer goods. In our current economy, debt is the fuel accelerating inflation. You can see this in items like housing, cars, and college where debt is the primary fuel driving prices higher. The big problem today is that incomes are simply not rising fast enough to keep up with the rise in other expenses. Over time, inflation has a big destructive power. I thought it would be useful to look at the cost of typical items in 1938 and compare them to where things stand in 2015.
Comparing 1938 to 2015
Over a year ago, we looked at some old data and found this to be useful to readers. I thought it would be helpful to update the data and see where things stand today in 2015. Someone sent this snapshot of the cost of living in 1938. It really is fascinating looking at inflation over a very long period of time. In this case, we are looking at spending pre-World War II. Most Americans probably have no sense as to what the cost of living was back then since they are mired in the fight of living paycheck to paycheck.
Take a look at the cost of living in 1938:
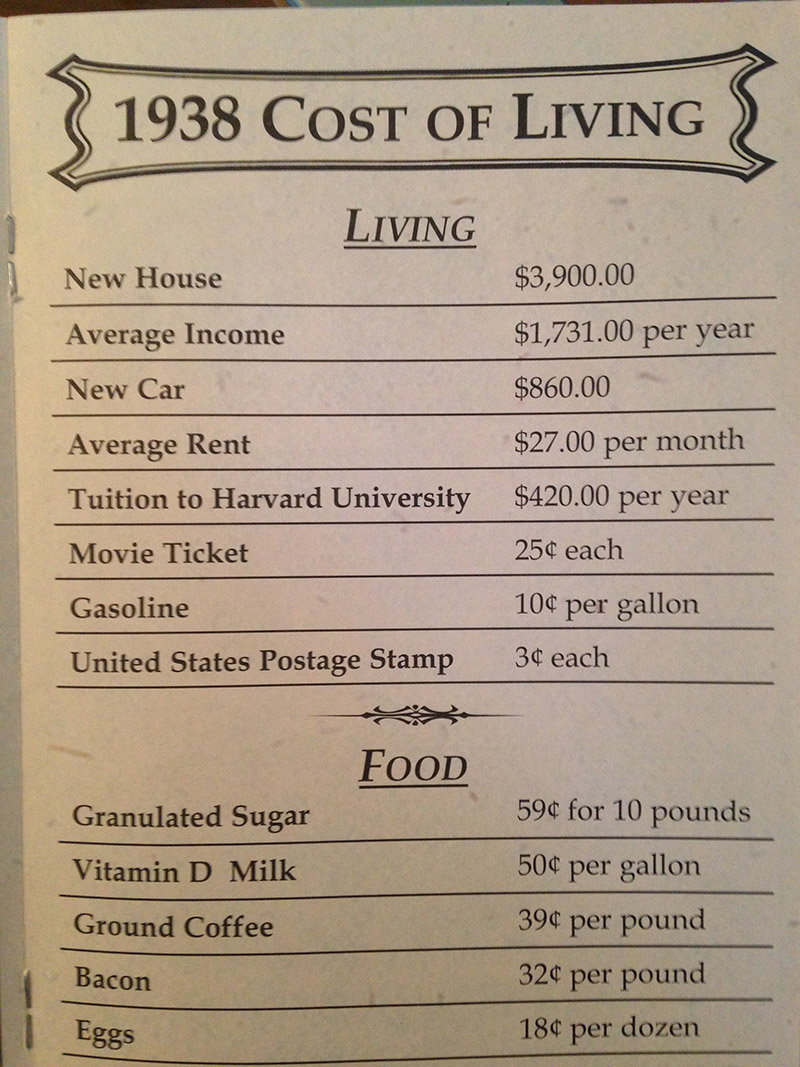
Source:Â Reddit
What is important is to look at income in relation to the cost of living.  A new home was about twice the annual average income. Today, with the median household income being $50,000 and your typical new home costing $298,000 we are definitely on the more expensive side (6 times annual income versus 2 back in 1938). Look at the new car costs. A new car cost about $860 or half of annual income. Today, a regular car can cost $32,000 and most will need to finance it. Tuition to Harvard was $420 per year and today Harvard tuition is nearly $62,000 with room and board:
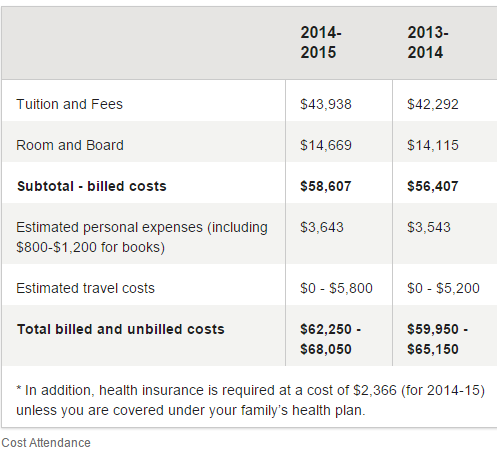
Source: Â Harvard website
In other words, the typical family of today would need to use all their annual income to send their kid to Harvard plus go in debt while in 1938, your average family had income to send 4 kids to Harvard per year. The most inflated of all categories is college tuition.
Looking at various costs adjusting for inflation
I put this table together and adjusted for inflation to give you a better perspective:
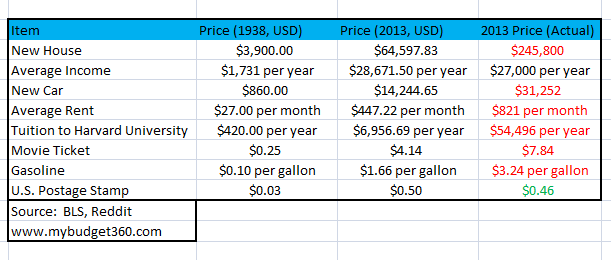
I wanted to update some of this data for 2015 as well:
New house: Â Â Â Â Â Â Â Â Â Â Â Â $298,000 (Source: Census)
Average income:Â Â Â Â Â Â Â Â Â Â Â Â Â $28,000 (Social Security)
New Car:Â Â Â Â Â Â Â Â Â Â Â Â Â Â Â Â Â Â Â Â Â Â Â Â Â Â Â Â $32,000 (Bankrate)
Average Rent:Â Â Â Â Â Â Â Â Â Â Â Â Â Â Â Â Â Â $950
Tuition to Harvard:Â Â Â Â Â Â Â Â Â See above
Movie ticket:Â Â Â Â Â Â Â Â Â Â Â Â Â Â Â Â Â Â Â Â $8
Gasoline:Â Â Â Â Â Â Â Â Â Â Â Â Â Â Â Â Â Â Â Â Â Â Â Â Â Â Â Â $1.99
US Postage Stamp:Â Â Â Â Â Â Â Â Â $0.49
So basically every single category is up besides gasoline given the crash in oil prices in 2014. But this is a small drop in the bucket given what consumes the biggest portion of your budget:
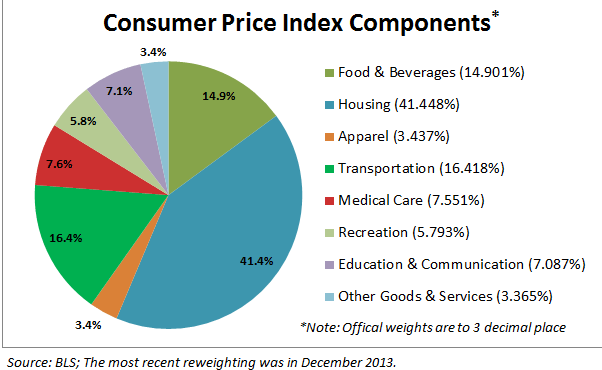
Housing, food, medical care, transportation, and education make up the biggest expenses. Housing by far consumes the biggest portion. And look at how fast prices have gone up since 2000:
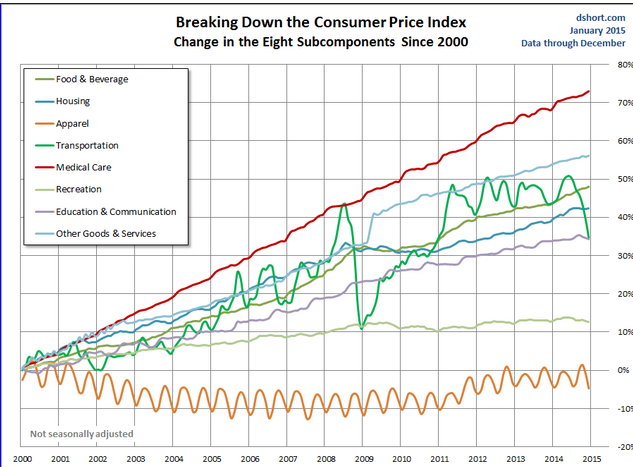
Medical care is up over 70 percent.  Housing is up over 40 percent even with the crash in the housing market. Basically the only items that held steady were apparel and recreation. But look at how incomes are doing:
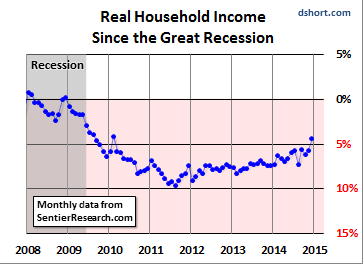
You wonder why you feel like you have less purchasing power? You feel poorer because you are thanks to the slow eroding power of inflation. The Fed would like to argue that there is no inflation but just look at housing costs, medical care, college tuition, and grocery bills and tell the regular working American family that there is no inflation.
If you enjoyed this post click here to subscribe to a complete feed and stay up to date with today’s challenging market! If you enjoyed this post click here to subscribe to a complete feed and stay up to date with today’s challenging market!Â
If you enjoyed this post click here to subscribe to a complete feed and stay up to date with today’s challenging market! 8 Comments on this post
Trackbacks
-
pete said:
Something that you did not account for was the average tax bill, State, Federal, and County. That will make yur figures look even more bleak!!!
January 27th, 2015 at 10:52 am -
Tom S. said:
These charts show the increasing Dollar Value of things… and that IS bad enough in itself…
… but there’s a far-more insidious evil that is often not explained in articles like this:
Here’s the simplest way to put it:
> Take all the ‘STUFF’ in the U.S. (All the wheat, oil, available man-hours multiplied by their ability, etc – call these “Wealth Units”) and the number of people in the U.S. at the same time. Compare THOSE.> Back in the 1920s, there was 100M ‘Real wealth units’ of REAL STUFF (not just Money), and ~100M people.
> In the 90s, there was about 20x the ‘Real wealth units’ thanks to advances brought about by Technology and the Computer Boom, and only 300M people.See what that means?
> There was 20x more ‘Good Stuff’ in the world… and yet, the Middle Class only had 3x more ‘stuff’ with 3x the population, for a total of 9x the Overall Wealth.
> So that means that 1.1B (2B – 900M) of those ‘Real Wealth Units’ went…. well… where?
Short Version:
– Why has technology gotten 20x better, but OUR LIVES have not gotten 20x better – (in some cases, worse!) ?
– Why do we live our lives more-or-less the same as people back in the 20s live theirs?That’s the REAL devil in this situation.
Someone is wholesale stealing the FAT of TECHNOLOGICAL PROGRESS… and throwing us some shiny new cell-phone as a scrap.
January 27th, 2015 at 4:06 pm -
Stacie Brumley said:
been telling people this for 11 years now, thanks for the awesome breakdown and visuals…there’s a reason my generation is struggling to reach the comforts of our parents’ parents.
January 28th, 2015 at 12:22 am -
DDearborn said:
Hmmm
“The $2 movie ticket becomes a $8 movie ticket.” Really? How about the 50 cent movie ticket, the 25 cent popcorn and 15 cent soda, and the 5 cent candy bar at the Saturday Matinee circa 1969? All of us in the neighborhood used to WALK the 2.5 miles to the theater and back in the summer time. Total cost for the afternoon? $1.00
January 28th, 2015 at 6:44 am -
AC said:
1938? Try 1913.
January 28th, 2015 at 1:11 pm -
Dmitri said:
You need to add a brief explanation of why the US headline number for inflation is so distorted: hedonic adjust, being one of several factors. I would mention shadowstatistics.com too.
January 29th, 2015 at 3:37 am -
Jim Martin said:
You have provided an excellent comparison that clearly shows why the majority of middle class U.S. families can’t seem to make ends meet anymore, even with two wages earners.
One important issue you left out is the ever rising tax burden on the middle class which has resulted in significantly less disposable income available to spend on food, energy, housing, and consumer goods. Taxes in 1938 were almost nothing. Today, we have a battery of taxes that are being leveled against middle class folks, including federal income taxes, FICA and medicare tax, state income tax, city income tax, property tax, school tax, state and county sales tax, gasoline tax, highway and bridge tolls, utility bill tax, phone bill tax, park user fees, etc. So, the situation is actually much worse than you may be lead to believe.
In addition, it now takes two median wages today in order to not make ends meet with a small family of four, whereas one wage earner could support a very large family in 1938.
Some thoughts for today:
1. “A penny saved is a penny earned” – Ben Franklin
2. “A penny saved is two pennies earned” – IRS
3. “For every action there is an equal and opposite reaction” – Sir Isaac Newton
4. “Don’t Start the Revolution Without Me” – Jesse Ventura, 38th Governor of MinnesotaJanuary 29th, 2015 at 8:45 am -
Peter Schiff said:
You left out the most important parts. In 1938 household income reflected the earnings of just one person. That is because in a married household only the man worked outside the home. Today’s household income reflects the earnings of two people. So for an apples to apples comparison you need to cut today’s household income in half and then compare that reduced income to current prices.
Also you need to look at after tax, not pretax income. In 1938 a man earning $1,731 per year paid zero federal or state income taxes, and just $17.31 per year in social security (unless he was self- employed in which case he paid zero). Also there was no medicare tax at that time. So at most taxes were just 1% of income. Today a house hold with $50,000 in earnings will pay $3,825 in social security and medicare taxes alone ($7,650 if self-employed). Income tax liability is harder to estimate as it depends on where they live and what type of deductions they qualify for, but if you assume an average rate of 10% total, that is another $5,000.
So today a couple where both spouses work and neither is self-employed pay $8,825 in taxes (not counting sales, property, or other taxes which are also higher now than they were in 1938) for an after tax house hold income of $41,175. In 1938 a single person (not self employed) earned $1,731, paid $17.31 in taxes, for an after tax income of $1,713.69.
So take $41,175, cut it in half and compare the cost of living to someone in 1938 earning $1,713.69 That gives you a far more accurate picture of the degree to which the average American’s standard of living has deteriorated.
January 29th, 2015 at 10:56 am