Personal income faces first year-over-year drop since recession ended: As incomes collapse, spending via consumer credit begins to increase.
- 0 Comments
There is little doubt that our economy runs on access to debt. Not a tiny bit of debt. But Himalayan mountains of debt. The banking crisis was pitched to the public as one of liquidity but in reality, it was one of solvency. The difference? One is a temporary inability to repay debts while the other is a complete mathematical inability to support current debts based on income. The Fed has done everything to increase access to debt to member banks to re-inflate their balance sheets. Those that think inflation is non-existent need only look at housing values, college tuition, and healthcare costs and see how realistic that is based on their income growth. This leads us to our current article in terms of personal income. The latest reading shows that personal income had its first year-over-year drop since the recession ended. This further underscores the massive disconnect between the stock market and regular American households. A large part of boosting corporate profits involved slashing wages, benefits, and households making due with less. This has increased the wealth and income inequality in our nation as the stock market reaches a new apex. What is troubling is that now that banks are flooded with easy access to credit, they are starting to lend to cash strapped households in a fashion similar to our last credit bubble.
Personal incomes fall
I’m not sure if people are aware of how rare it is for personal income to fall on a year-over-year basis in a fiat system where inflation is championed.Â
Inflation when it goes hand in hand with income growth is rarely felt by the public at large. However, as we have discussed with the shrinking middle class, inflation with no subsequent wage growth translates to a declining standard of living.
Going back to data form the 1950s personal income never declined on a year-over-year timeframe. That is until the Great Recession. So this recent reading showing personal income declining year-over-year is notable:
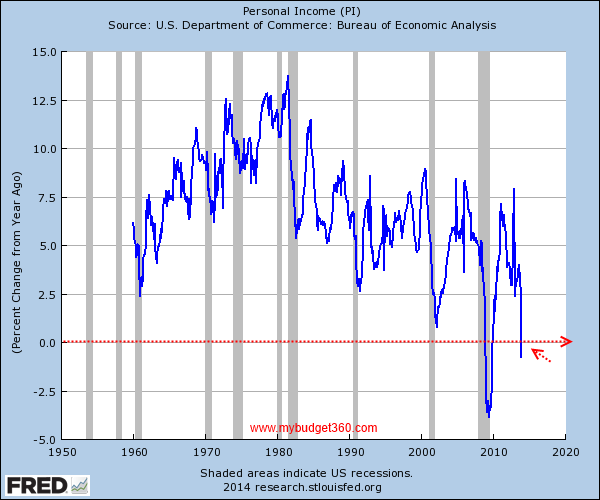
It is rather clear what is going on here. Starting in the late 1990s, we see that personal income was facing some severe constraints on growth. That is, until the debt bubble of the 2000s papered over the reality of growing wealth and income inequality. The public of course mistook access to debt as access to wealth. Of course debt needs to be paid back and paid back with what? Income. This is why income and debt are two sides of the same coin. Eventually reality catches up. It may take a few years or a generation as we are witnessing, but at a certain point debt no longer has the underlying boosting impact it once did. This is why we are seeing cheap mortgage rates not helping out regular income strapped home buyers in the housing market because large banks and investors are crowding out regular home buyers with cash strapped balance sheets.
Substituting income growth for debt growth
Banks have already gotten their fill from bailouts and very friendly accounting rules bending to assist a shadow bailout. Yet the public has not benefitted since the Great Recession officially ended in the summer of 2009.
Now that banks have had their fill and the stock market makes new peaks, we see lending now coming back into the system for regular Americans. But is this good if incomes are declining?
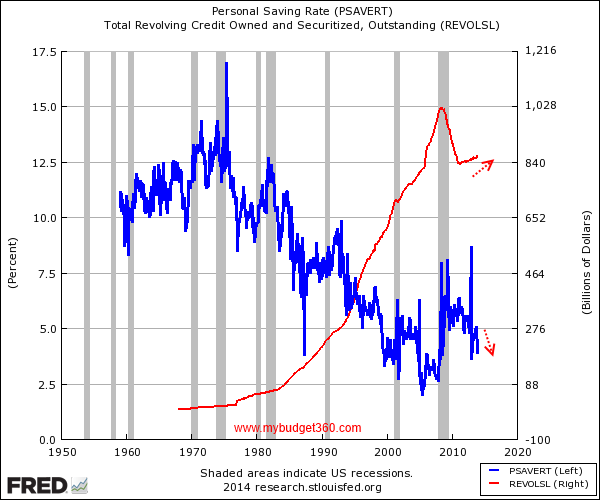
The above chart is illuminating. It shows that Americans are substituting saving for purchases with going into debt, once again. Revolving debt took a hit during the Great Recession but only recently has it started to increase. This wouldn’t be such an issue if incomes and good paying jobs were abundant but they are not. Instead Americans to keep up with the rising cost of goods are now using an old trick of borrowing to make up where incomes are faltering.
Deep changes to economy
This Great Recession was no ordinary recession. We now have nearly 48 million Americans on food stamps at the same time the stock market reaches a new peak. Not that this helps many since most Americans don’t own stocks and recent corporate profits have been boosted by slashing wages, cutting benefits, and simply squeezing more out of current workers. This is why we are seeing growing inequality. You also see some major structural changes in terms of employment:
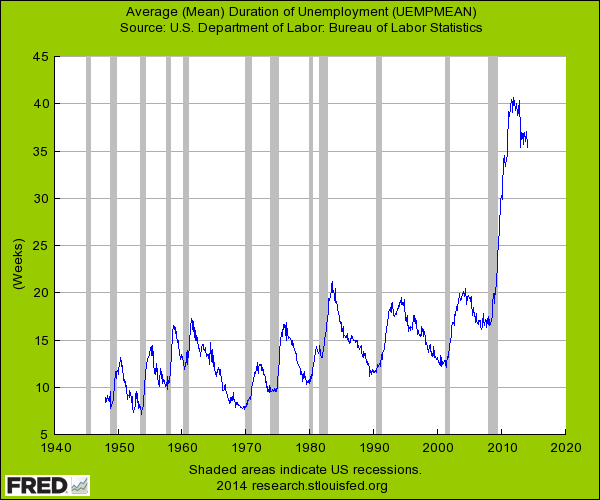
The average duration of unemployment is still incredibly high at over 35 weeks. In previous recession, the high point was typically around 20 weeks and we’ve had some bad recession since 1940. Nothing however, like this current economic shift. Remember that this high average duration of unemployment is happening nearly five years after the official end of the Great Recession in the summer of 2009. All this information simply points to a shrinking middle class and more inflation in items that matter for regular buyers (i.e., homes, cars, tuition, healthcare, etc). You don’t need to be an economist to know that falling personal income in a consumer based economy is a bad sign.
If you enjoyed this post click here to subscribe to a complete feed and stay up to date with today’s challenging market! If you enjoyed this post click here to subscribe to a complete feed and stay up to date with today’s challenging market!