Recessions: The Last 5 Recessions and Measuring how long we will have job losses. This will be the worst recession since World War II.
- 2 Comment
Forecasting is a tricky road to walk on in the investing world. That is why trying to predict future job losses is more of an educated guess. In fact, the National Bureau of Economic Research (NBER) only recently stated that we were in fact in a recession. I have put out an estimate that by the end of 2009 we will see the U-6 unemployment number shoot up to 19%.
Today, we are going to look at the previous five recessions with our current recession included. We will look at various charts and data and try to figure out what kind of recession this will resemble.
Market volatility is never a good sign but this normally occurs before we see any major job losses. In fact, up until September we did not see any significant job loss numbers. The vast majority of economist in late 2007 were saying we wouldn’t be in a recession. Then in early 2008 they said it would be a minor recession like the brief one in 2001. Now, it has turned out to be the worst recession since World War II. If we simply looked at 10 indicators of market distress this would have been apparent over a year ago.
First, let us look at the previous five recessions and their monthly job losses:
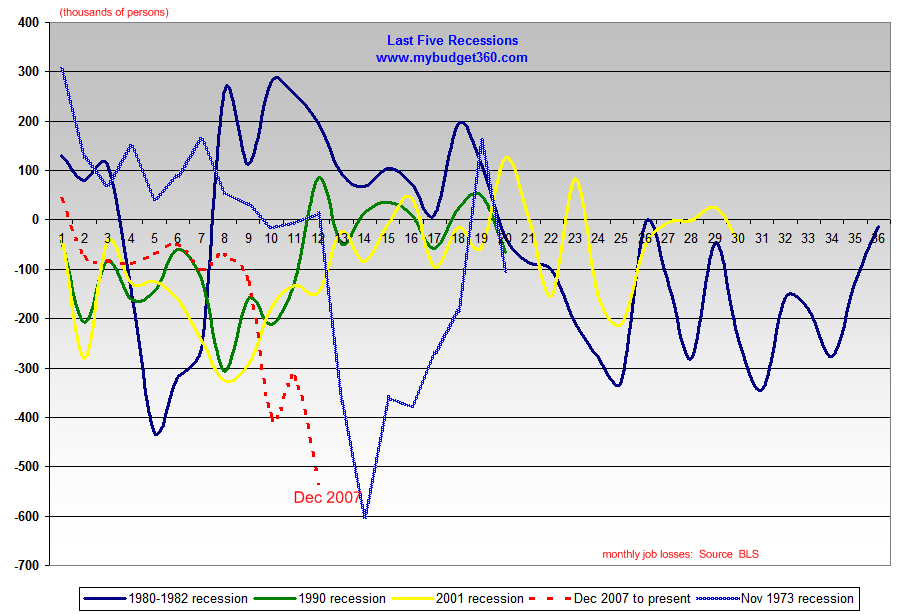
Click for a sharper image.
What I have done is matched up the last five recessions with their start month according to the NBER. What you’ll notice, is up until the 9th month, job losses were occurring but at no significant level in this current recession. The last 3 months the pace has drastically picked up.
Some analysis. Already you can see that with the early 1990s recession and the 2001 recession, job losses were abating and the trend was moving upward and adding jobs. We have already diverged from that model so it is clear this recession will be more severe than those two.
You’ll also notice that the 2 back to back recessions of the early 1980s saw a quick downturn, sharp up turn, and then a down turn once again. What we can learn from the early 1980s recession is that it is possible to go from a brief recession back to recovery, and back to recession quickly. In fact, you can see that for 36 months the employment situation was extremely volatile. Already our model of job losses does not match that model.
The next recession is the recession that started in November of 1973. As you can see from the chart, it initially started out with job losses picking up pace and then suddenly in month 12, the number just fell off a cliff. Yet a quick recovery did occur here as well. So far our current recession resembles this the most. Yet this would assume we would have a quick uptake in jobs within 6 to 9 months. Now this may be possible since we already know there will be a massive stimulus come 2009. Yet the question is can government job growth keep up with private sector job losses? In fact, recent estimates of jobs added is in the ballpark of 2.5 million. Well this year we have already lost 1.9 million. One more month like November and that 2.5 million is simply enough to replace what has been lost so far.
It is also the case that this recession may actually be worse. Keep in mind the above graph is raw numbers of jobs lost per month. We have grown in population over time so the graph is just to give you an idea how long recessions can go and their typical pattern. Yet I would argue this recession is worse than any of these. We would have to go back to the 1950s to get a better sense of what to expect. But even then, we did not have such a global market downturn where $50 trillion in wealth has vanished in 1 year.
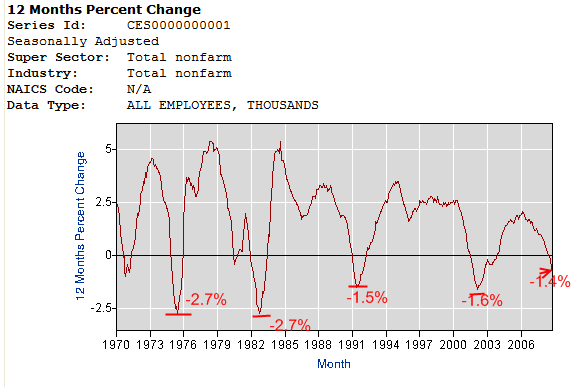
Let us look at another indicator of job losses to give us an idea how things can play out during this downturn. We are going to look at year over year percent losses:
Â
This chart is telling. Combining these two charts we can derive the following information:
(a)Â We are in the early stages of a severe recession
(b)Â We may only be at the half way point in terms of job losses if we have a recession like that in the early 1980s or 1973.
If you look at the above chart with monthly job losses, we already know this will be more severe that the early 90s or 2001. That is certain. Even our year over year job loss numbers are on par with the previous two recessions already. Interestingly the early 1980s recession and the 1973 recession both had a peak yearly job loss decline of -2.7%. If that is the case, we can expect to see more job losses for months to come.
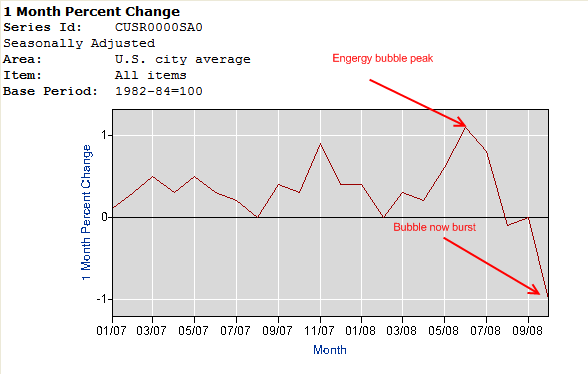
We are also dealing with deflation here which is something not seen in decades. Keep in mind that the early 1980s recession and that of 1973 had inflation as their archenemy. We are nowhere near inflation right now. Housing is going down. Energy has collapsed. Wages are stagnant or declining. This is deflation. Let us look at the CPI over this timeframe:
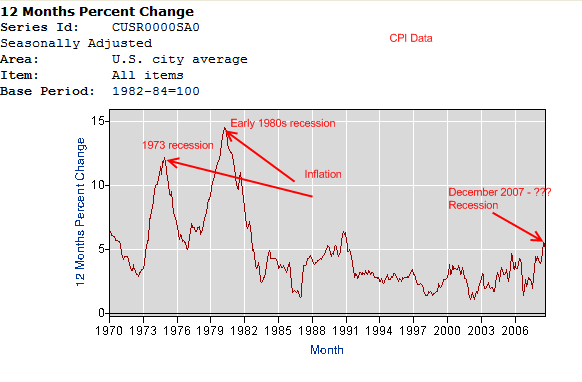
This is clearly a different beast here. As you can see, the 1973 recession and the early 1980s recession both had high inflation rates. We do not have that today. In fact, over the past few months with the energy bubble bursting the rate is collapsing clearly signaling deflation:
So what can we conclude? This recession will be worse than any discussed here. This will turn out feeling like a minor depression. We already have a 12.5% unemployment rate measured by the U-6 BLS number. We will reach 19% by the end of the year. We are in the early stages of a long and drawn out recession. The actions taken so far of injecting liquidity into banks and nationalizing various institutions tells us we are going down the Japan model of facing a lost decade. What does that mean? A long and poor employment climate with anemic GDP growth.
Let us hope that this is only a severe recession and not a depression.
 If you enjoyed this post click here to subscribe to a complete feed and stay up to date with today’s challenging market!
Â
If you enjoyed this post click here to subscribe to a complete feed and stay up to date with today’s challenging market!2 Comments on this post
Trackbacks
-
David Bennett said:
This is a very good analysis of recessions. I am very interested in the “deflation” aspect. We all are wanting to better understand what is happening. It certainly seems like the western world is attempting to re-inflate their economy(s).
I am still troubled by the introduction of the bailout monies into the private sector here in the U.S.A. After reading this article it causes me to question whether the 8 trillion dollar bailout (by some estimates) will cause hyper-inflation OR will it be mitigated by the 50 trillion dollar loss of wealth as presented here? In other words, Does this wealth loss counter the introduction of unbacked specie into the system?
Could the effect be to be that dollars will hold some residual value and asset values stabilize to some new equillibrium? It also looks like a depression to me and the next few years will most clearly reveal the truth of the matter. I have been taking a survivalist position in metal, food, essential goods, debt avoidance and always faith in Christ.
December 14th, 2008 at 7:26 am -
gumby Baer said:
“Detroit Churches pray for jobs, auto recovery” n y t imes
December 15th, 2008 at 12:37 pm