American Debtor Psycho: $49 Trillion in Debt. The Real Reason why the Credit Crisis is Bigger than you Think.
- 5 Comment

This report may come as a surprise to you. It is often thrown around that we as a nation are heavily in debt. We hear the words billions and now even trillions being thrown around with really no breakdown of where the debt is flowing to. In this article, we are going to breakdown every single major area of debt in our country. You will soon realize why the credit crisis has the potential to be much bigger than once thought.
There are 8 major areas where Americans are heavily in debt. When most Americans think of the total debt outstanding they usually think of the U.S. National Debt which has gone over $10 trillion recently and is increasing at an alarming rate of $3.4 billion a day. Yet there are more troubling areas that even dwarf this astounding number. Overall there is $49 trillion in total outstanding debt in the United States.
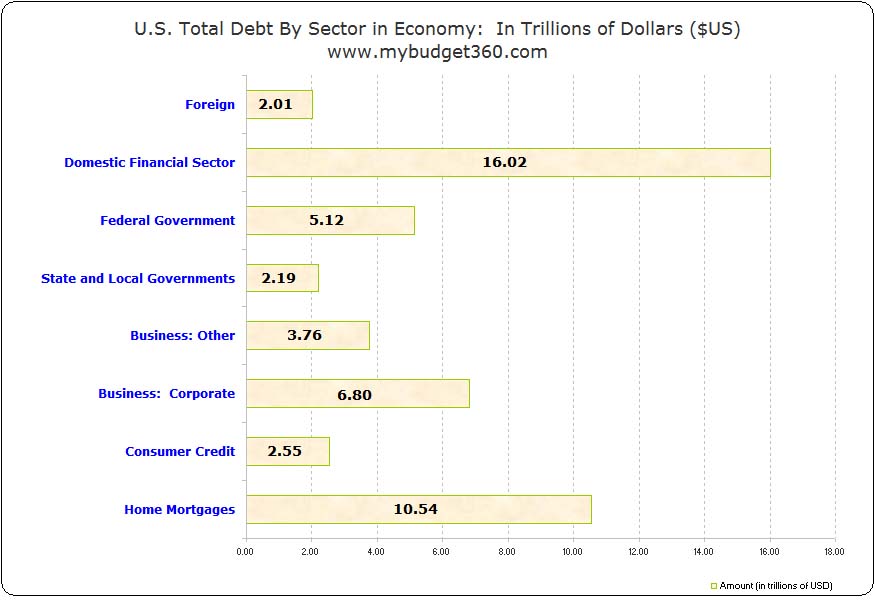
I have constructed a graph highlighting the 8 major areas from the latest Federal Reserve Flow of Funds Account which was released late last month:
*Click for larger picture
Debt Area #1 – Foreign
Amount:Â $2.01 Trillion
This is one of the smaller areas (if you can call $2.01 trillion small). Foreign debt as represented in the Federal Reserve report is amounts borrowed by foreign financial and non-financial entities in U.S. markets only. Given the global nature of this credit crisis you will understand why it was so vital for a global concentrated effort to provide funds across the world. That is why many counties in the Euro-zone have recapitalized their ailing financial industries during this credit crisis. Just as there are foreign firms in the U.S. that borrow heavily within our markets, we have our own companies in foreign locations that borrow heavily as well. We are all coupled together in this mess.Debt Area #2 – Domestic Financial Service
Amount:Â $16.02 Trillion
This is buy far the largest sector of debt in our country. So when you hear about the massive injections to Wall Street, you can see that it also goes to the most heavily indebted area. Main Street Americans get a lot of flack from Wall Street types trying to usher the blame onto people who didn’t live within their means. Clearly, we rarely hear about this number in the mainstream media probably because most of these people also own a part of the media stations. You wouldn’t bite the hand that feeds you right? Easier to blame consumer debt for all this mess. This is also a major reason why the Fed has also stepped in to inject major capital into 9 of the largest U.S. banks in effect nationalizing a part of the institution. Do you see the Fed injecting money into your bank account? Probably not.
Debt Area #3 – Federal Government
Amount:Â $5.12 TrillionÂ
What is often quoted in the media is the $10+ trillion in national debt. This is probably the most cited number of the entire $50 trillion outstanding. However, the reality is that approximately $4 trillion of this amount is actually future commitments to programs such as Social Security and Medicare while over $5 trillion is held by the public. The best chart I have seen on this is incredibly by Ross Perort:
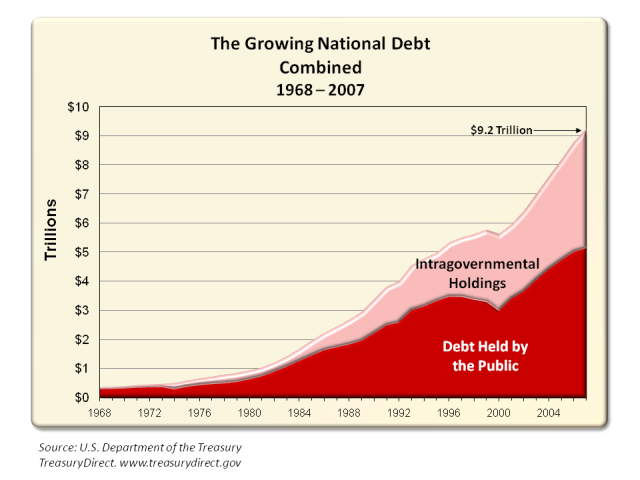
*Source:Â Perot Charts
Whatever you may think of his politics at least he does a good job explaining the massive debt floating out there. Keep in mind the above chart does not have the recent bailout bill which already has increased the debt ceiling to $11.3 trillion. Not a good sign.
Debt Area #4 – State and Local Governments
Amount:Â $2.19 Trillion
States like their big daddy in the Federal government also have no modulation on spending control. They also spend with no censorship. One perfect example of this is California. The state stalled out and had its longest budget stalemates. Finally, the budget was signed with a patchwork of piecemeal agreements. It was kick the can down the street plan. This plan didn’t even last a few weeks and the state had to go out and issue $5 billion in bonds simply to stay liquid. Welcome to the perpetual motion of debt on top of debt. Would you expect anything different from states when the Federal government is setting a culture of crony capitalism? That is, bail out the major financial sectors while letting the average American family fall further and further behind.
Debt Area #5 – Business: Other
Amount:Â $3.76 Trillion
The new model of business is high leverage. Even during the credit crisis, we were hearing stories about certain small businesses who were unable to pay their bills or meet payroll because of the freeze up in the credit markets. These people are also leveraged to the hilt. Everyone is nuts with debt!
Debt Area #6 – Business:Â Corporate
Amount:Â $6.8 Trillion
Corporate folks are notorious for going into debt. All you need to do is pull up a few random companies from the Dow Jones Industrial Average and we can quickly see how much debt is on their books:
Caterpillar Inc:Â $50.9 billion in total liabilities
General Electric:Â $717 billion in total liabilities
Johnson and Johnson: $41 billion in total liabilities
Now this isn’t to say they are in trouble. For example, a solid company should have a strong total equity base. For example, Johnson and Johnson has total assets of $88 billion so they have a total equity value of $46 billion.
total assets – total liabilities = total equity
But again, this is to highlight how dependent our society is with credit. The credit markets freezing up impact every single area of what we now know of as our hybrid market system. I hesitate to call it a free market since we are seeing a mix of corporate socialism here. Hardened free market fundamentalist have a hard time saying socialism especially when they are the ones calling for it. But that is what it is. Look at what was done with the domestic automakers. This was the same thing that was done for the big financial institutions.
Debt Area #7 – Consumer Credit
Amount:Â $2.55
You would think that this area would be bigger but it looks small in relation to the other areas. Yet this area has the biggest perceptible bang for the buck. In this area we have auto loans and credit cart debt. You will also find student loan debt here. The growth in this area is really astonishing. We went from $1.5 trillion in 1999 to $2.55 trillion currently. Why this is astonishing is that Americans have seen stagnant wages over this time. What this means is the American consumer used debt to keep their quality of life up. A façade that couldn’t last forever. Many reports state that consumption is roughly 70 percent of our GDP:
GDP = consumption + gross investment + government spending + (exports – imports)Â Â
With a GDP of $14 trillion this would be a very large amount of money. Now given that folks also purchase things in “cash” for example groceries, gas, or maybe tickets to a ball game, not everything bought is put on the plastic. Many folks are simply taking out I.O.U.s for instant gratification. This is now coming to a stunning and spectacular halt. The consumption side of the equation is now faltering badly. A widely watched report showed that retail sales fell 1.2% last month causing the market to slump drastically the day the report was issued. This area in fact may be the next major shoe to drop. Many Americans are now using one credit card to pay another one off doing a financial juggling act only destined to have all balls drop sometime in the near future. With a deteriorating employment situation where is the money going to come from?
Debt Area #8 – Mortgage Debt
Amount:Â $10.54 Trillion
This may be the most troubling of all the above sectors because it hits many Americans squarely in their largest financial investment. Seeing your equity disappear while your debt remains the same is not pleasant. The Case-Shiller Index which is now widely used to view price changes is off by 19% from its peak price. Given that at the peak it was estimated that U.S. residential wealth was at $24 trillion, we now have seen $4.5 trillion in housing equity disappear:
$24 trillion x 19 percent = $4.56 trillion in equity gone from peak
What this does is it also hurts the financial ratio of equity to debt with a homeowner:
Peak:Â $10 trillion debt / $24 trillion real estate value = 59% equity in homes
Current:Â $10.54 trillion debt / $19.44 trillion real estate value = 46% equity in homes
So what happens, is the amount of equity Americans have in their homes is now falling as values fall. But what hurts the equation even more is debt remains the same. This is also one of the reasons foreclosures are jumping since many Americans are unable to make ends meet and having no equity, they are unable to sell since they are underwater. How so? Say you bought a $400,000 home in a bubble area with zero down. The home is now worth $300,000. In order for you to sell at the current market price, you would need to put in $100,000 of your own money to move the home. No one economically speaking will do this. So many will ask their lender for a short sale. An amount this large will normally not get approved although many lenders are now wising up to the current economic crisis. However many more are simply not sending in payment anymore and letting the foreclosure process take over.
Total Debt:Â $49 Trillion
This is a big problem since most would agree we are now in a recession.  Certainly many states are. With so much debt, it would seem the only way out is for much of this debt to be written down.  This is already occurring. Foreclosures are forcing banks to realize losses.  Credit card delinquencies are rising.  Auto loans are going into default at record rates.  This is also a form of money destruction. And it has to occur.  There is no other way.  Incomes are stagnant and it would appear that we have a few years before things bottom out. This will be a serious challenge for many of us to confront.
What you are going to see for the next few years is a healthy aversion to debt. Â Otherwise you are going to drive yourself mad trying to digest these absurd numbers.
If you enjoyed this post click here to subscribe to a complete feed and stay up to date with today’s challenging market! If you enjoyed this post click here to subscribe to a complete feed and stay up to date with today’s challenging market!
5 Comments on this post
Trackbacks
-
Uncle B said:
How much money do we have to print to knock 20% off of this debt through devaluing our dollar and eventually making each one dollar easier to earn? If we look at paying interest only on the debt, with hugely devalued dollars can we get ahead? My logic is: if somebody is dumb enough to lend me money in units I control the value of, after the loan is on paper, and the ink is dry, what is stopping me from deflating the units so deeply, paying the fixed, printed paper debt is child’s play? Why does OPEC use “Purchasing Power Parity” to set the price of a Bbl of oil? An emergency meeting of OPEC in a few weeks might reduce the amount of oil they produce, in order to get more money per Bbl. The “money printing spree” of the Bush regime will have the same effect, and is already causing inflation in the U.S.A., domestically. Are we better off printing money to reduce the net effect of debt, and suffering inflation, or must we, the people on the ground always bail out the government, Banks, and Wall Street crooks with food from out tables? Socialism didn’t work, the U.S.S.R. collapsed due to money problems, Obviously Capitalism doesn’t work without willing slaves, What is left?
October 20th, 2008 at 10:21 am -
Dana Visalli said:
Good job, thanks for the work, hard to believe there is only one comment on this stunning issue. The numbers need updated, here in early 2009. Some explanations could be clearer….I’ve seen much higher numbers for federal debt and future obligates….J&J says it has 88 billion in assets but I wonder what this means and how realistic it is? Goodbye Caterpiller, somehow I’ve come to hate that company. Bottom line: these debts will never be repayed. Time to “make other arrangements.”
January 28th, 2009 at 5:49 pm -
Current account said:
If the federal government does not want to pay the benefits that I and my employers paid for my retirement, then give me the money paid in back with accumulated interest at market rates. If I had known that the money taken from me and my employers to “insure” my retirement would ultimately be stolen from me by the government, I would have asked for it back and I could have invested it to protect my retirement.
January 29th, 2009 at 8:53 am -
Evan said:
I notice your little comment on student debt. Having been caught up in that little debt cyclone myself, I wrote a piece about this on my blog.
http://planetisrael.blogspot.com/2009/05/student-loan-scam.html
This portion of the debt may be relatively small but it will be very difficult to clear as there is no legal way to renegotiate, modify, bankruptcy or otherwise eliminate the debt.
May 25th, 2009 at 1:26 am -
Bill said:
Under “Federal Government” you list 5+ trillion. Why do you not count the “future commitments”? The real truth of the matter is that the SS Trust Fund doesn’t really exist. It has been spent and in its place are IOUs. To replace that which has been spent, the Govt will have to re-tax in order to provide that which it had already taxed for in the first place.
So by what reasoning do you just ignore this?
September 16th, 2009 at 7:26 pm