The math on US income – if you call something the middle make sure you are using math. The surprising details on median household income and per capita wages.
- 19 Comment
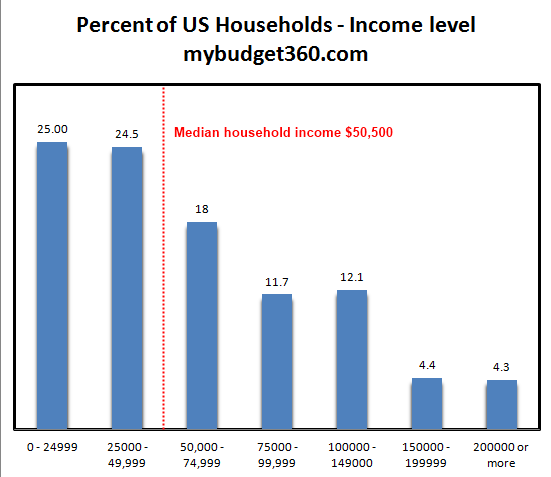
People have a hard time wrapping their minds around household and personal income.   It is an easy enough concept to understand but some throw around terminology that confuses the facts. For example $250,000 is not middle class income if we define it from a strictly mathematical model. The median household income in the US is $50,500. In other words, half make more than $50,000 and half make less. If you as an individual made more than $250,000 that would put you in the top one percent of all earners in the US. For households making more than $250,000 per year this would put you in the top two percent of US households. Let us look at the income data carefully.
US household incomes
First it is important to actually break down the data from the Census:
Source:Â Census, ACS 2011
The latest Census data has the median household income in the US at $50,500. But as the chart above highlights one out of four US households are living with less than $25,000 per year in household income. This makes sense when we measure this up against Social Security data that has the median per capita worker income at $26,000 for 2010. You also begin to realize why two income households are almost a necessity to get by in American today.
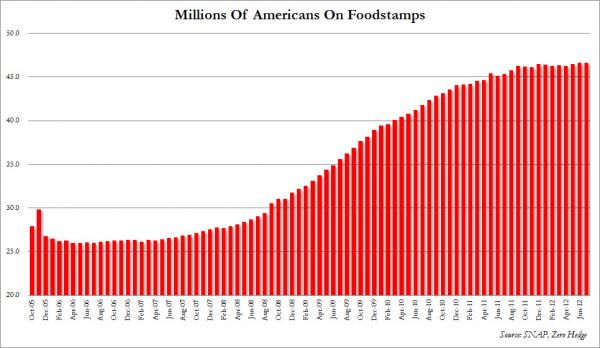
In fact, if you are in a household that makes more than $100,000 per year you are in the top 20 percent of all US households. As we mentioned earlier, making more than $250,000 is nowhere close to “middle class†if we actually follow the rules of math. Sure, some might feel they are middle class at these levels but they are missing the bigger picture in that many Americans are barely scraping by (they are in the top two percent here). We have over 46,500,000 Americans on food stamps both a raw record and a record as measured by the percent of our population on this program.
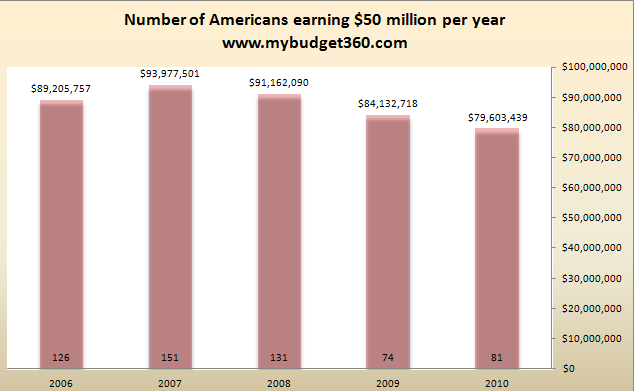
If you want to take a glimpse at the very high end of earners, we can look at those making more than $50,000,000 per year:
The number of those making $50,000,000 or more has certainly fallen since the peak in 2007. It’ll be interesting once we have 2011 data since this will capture the big stock rally we have had since early 2009. In 2010 only 81 Americans made it to this level.
I find household income data the most relevant because it gives a true sense as to where the typical US household really is in the current economy. The $50,000 median income level tells us a lot but it doesn’t really explain the extremes. Why in this recovery have we seen food stamp usage remain at a peak?

We also have over 53,000,000 Americans receiving Social Security, a number that will only expand with demographic trends. The economy as always is a big complicated machine but one thing has emerged in the last few decades:
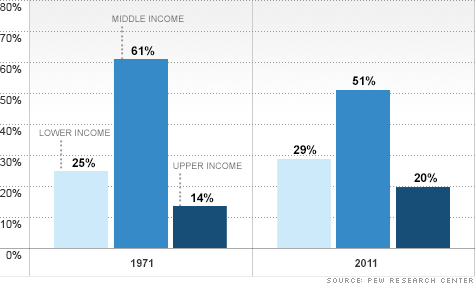
-Those at the bottom have increased as a percentage
-The middle has been hollowed out
-A few more have trickled into the higher income category
What does this chart tell us? We have a large number of Americans falling in the low income category. The middle class has been squeezed. Those earning higher incomes have also increased reflecting an economy favoring very specialized high income training (i.e., doctors, engineers, scientist, etc).  Looking at the data we have to ask whether there are any policies that can help in broadening the middle class. It is unlikely given that the majority of new jobs are lower wage jobs and the expansion in more technical jobs do carry higher wage levels but these jobs as a ratio of total jobs is limited. It also helps to explain the high structural rate of unemployment.
In sum, when you hear middle class remember this:
The middle point for household income is at $50,000 (Source:Â Census ACS)
If your household makes more than $100,000 you are in the top 20 percent of households
The average per capita wage in the US is $26,000 (Source:Â Social Security wage data)Â
If you are calling something the middle make sure you understand some math terminology. I’m sure the media would love to keep people in the dark so they can keep spending money as if they were part of the top tier of income earners.
If you enjoyed this post click here to subscribe to a complete feed and stay up to date with today’s challenging market!19 Comments on this post
Trackbacks
-
Ironmike said:
The author states that “Those at the bottom have increased as a percentage; the middle has been hollowed out; a few more have trickled into the higher income catagory”. An look at the actual numbers shows a different story. The middle income group declined by 10%, 6% of that entered into the higher income group and 4% into the lower income group. So while it is undesirable that the lower income group has grown most of the change in the middle income group has been upward.
But while it may be instructive to identify the median income, it is more useful to answer the question of relative buying power over time. Does someone at the median income have more or less purchasing power now than 10 years ago? Because, after all, it matters just as much what one can buy with $50,000 as it does how many earn that amount.October 13th, 2012 at 9:30 pm -
jamesbbkk said:
It would be interesting and probative to see the differences in these income levels in various places one might live. $100k per year in San Francisco, DC, Ventura or NY City is not the same as that income in Cedar Rapids or Lubbock.
October 14th, 2012 at 4:16 am -
clarence swinney said:
as usual outstanding stuff thanks you are the best
October 14th, 2012 at 6:03 am -
William Myers said:
If you subtract the upper 10% income what is the new median income?
October 14th, 2012 at 8:18 am -
MingoV said:
Your 1971 vs. 2011 chart is biased because you failed to account for the fact that fewer households in 1971 were headed by a single adult. Many of today’s households are either single person (unmarried, divorced, or widowed) or single parent. If households today had compositions similar to those of 1971, then less than 20% would be low income.
October 14th, 2012 at 9:31 am -
MingoV said:
A second comment: Median income is not as relevant for retirees who own their homes, have no dependents, and don’t have to pay for most of their health care. The greater number of retirees today reduces median household income WITHOUT reducing the numbers of households maintaining a median income-lifestyle.
A third comment: Government benefits such as Medicare, Medicaid, SNAPS, and earned income credits have value and should be counted as income when making comparisons, especially comparisons to past years when fewer households received government benefits and the benefits weren’t as generous.
October 14th, 2012 at 9:41 am -
johngalt47 said:
The last chart is confusing. We have three bars for each year, but no info on how those groups were constructed. There was nothing in the post about what constitutes lower income. The 20% for 2011’s higher income was referenced, but what cut off constitutes teh 14% for 1971?
October 14th, 2012 at 12:06 pm -
hbp said:
Perhaps people are defining middle income socilogically, rather than mathematically. Upper income may only be the top 1%; middle income would be 2% down to 70%. or maybe down to the poverty line.
October 14th, 2012 at 3:35 pm -
WhichWaldenPond said:
Nice analysis. But my family income, just over $100,000 puts us in the upper 20%. But after taxes, we feel ourselves on a tight budget. We have never bought a new car, only used. We keep the house at a cool temperature, and take every action to reduce electricity consumption. We postpone house repairs. We shop in used clothing stores. We worry about retirement financing. We rarely eat out. I think Mitt is right, that the income needed for the media stereotype of a middle class family is $250,000. Then you can buy new cars, take trips, eat in restaurants, etc.
October 14th, 2012 at 11:42 pm -
Jim said:
Very informative. I did learn something from this analysis. However, it is only one dimensional in a multidimensional economy. For example, it does not take into account the cost of living in certain geographical areas. Earning 200K and livng in New York has a totaly dfferent cost structure then earning 200K in Nashville, TN. I suspect, although I don’t have the numbers, that if you took into account the cost of living the middle would be different (and higher).
October 15th, 2012 at 5:58 am -
Ulysses said:
Incomes measured in fiat currency are totally meaningless. It is only what they will buy in the marketplace that counts.
For example, four decades ago when the U.S. dollar was still tied to gold, one dollar would buy four gallons of gas. Today you need four dollars to buy one gallon. The situation is very similar with all other necessities of life. To paraphrase Yogi Berra, a dollar isn’t worth a dime any more.
Therefore to ignore these realities and keep blindly looking at the numbers (which really do not mean anything) is an exercise in futility.
October 15th, 2012 at 10:43 am -
mike said:
^ Mitt is wrong. The TV stereotype of a middle class family is also wrong, as it reflects, as you’ve noted, a family in the top 2%. A president is supposed to be able to tell the difference between television and the reality of his or her constituents. If Mitt can’t, or won’t, this suggests he is either incompetent (in that he believes most people truly do live on 250k a year) or malevolent (in that he knows the median income is a fifth of this but is only interested in preserving the interests of his fellow millionaires and billionaires).
Neither makes him a desirable choice for office.
October 17th, 2012 at 11:26 am -
clarence swinney said:
mitt is pushing extension of Bush tax cuts dumb dumb
1% get 37.6%–5% get 48.3%–bottom 60% get 16.4%Gift to rich on borrowed money
will we ever learn?
October 19th, 2012 at 8:01 am -
clarence swinney said:
PAY OFF DEBT
Total National Income $14,000B
Tax 50%=$7000B
Debt $=$16,000B
Budget $3800B
$3200B surplus
Pay off in 5 yearsOctober 20th, 2012 at 6:58 am -
Jeff said:
Measuring income per household versus per capita can be misleading if you don’t take into account changes in household sizes.
For example, a married couple both earning 50,000 make one household with 100k income. Then they get divorced. Now you have two households with 50k income. Yet income hasn’t changed at all.
October 20th, 2012 at 7:25 am -
clarence swinney said:
We rank 4th on inequality and 3rd least taxed in oecd
Since 1980, we borrowed and let rich off the hook to get ultra richINEQUALITY YES
Net Wealth-2010
1%=35%
5%=635
10%=77%
80%=11%
Financial Wealth
1%=42%
5%=72%
10%=85%
80%=5%October 20th, 2012 at 1:11 pm -
Joe said:
Dear WhichWaldenPond,
If you choose to have kids, expect your budget to be squeezed. That’s a lifestyle choice you made. There’s a lot of DINKS out there making the same amount without that issue.
Also, if you choose to buy a house, expect your budget to be squeezed. Again, another lifestyle choice.
I’m not passing a judgement on your choices but it should be understood that not everyone in your income bracket live the same way you do. There’s a difference between what we need to have and what we want to have.
October 24th, 2012 at 9:35 am -
household manager said:
if you decide to buy a house, expect your budget to be squeezed. Again, another lifestyle choice. Now you have two households with 50k income. Yet income hasn’t changed at all.
November 10th, 2012 at 4:57 am -
James Adams said:
This national numbers only show why the federal government is not capable of dealing with regional problems. Income vs. local cost of living is a true measure of ones economic standing. As mentioned several times by other comments, any discussion of wages without taking into account local cost of living is bogus.
November 11th, 2012 at 1:07 pm


 If you enjoyed this post click here to subscribe to a complete feed and stay up to date with today’s challenging market!