Shadow Housing Inventory: Getting an Actual Housing Picture of California Foreclosures and REO Numbers.
- 1 Comment
I’ve been seeing many articles asserting that currently the housing numbers for states like California are not reflecting the actual housing inventory on the market. Many of the articles argue that lenders through the process of taking back properties via auction are holding off on putting properties onto the Multiple Listing Service (MLS). As I discussed in an article highlighting the tools on the market, trying to get a general ballpark figure for the California market is rather simple and I think relying simply on one data source for all your information can be problematic.
In this article I’m going to attempt, albeit in a very rough estimate to give an overall total count of California inventory and foreclosures on the market.The first step is to get an accurate figure of how many homes are on the market. We can look at data provided by the California Association of Realtors.
The data for June of 2008 reveals the following:
Seasonally Adjust Annual Home Sales: 420,550
Unsold Inventory Index (months: 7.7
With this information at hand, we can figure out the monthly average sales rate:
420,550 SAAR / 12 months = 35,045 homes per month
Yet we encounter already some issues in this number. First, let us total up the first six months of actual sold home data from DataQuick:
2008 Monthly California Home Sales
January: 19,145
February: 20,513
March: 24,565
April: 31,150
May: 33,024
June: 35,202
1st Half California Home Sales: 163,599
The SAAR figure from the C.A.R. looks to take the current month of data June and multiplies it out by 12. Of course, you can see that overall this skews the numbers. The data for July and August will most likely be high as well but the fall and winter are always slower selling seasons and given the current economic climate, this should prove to be the case as well.
I took a look at the September through December 2007 sales numbers and they average out about 25,000. So let us assume that for July and August we keep 35,000 sales and for September through December we’ll have 25,000 per month sales. We can best approximate that for the year of 2008 given that we already have the first half complete, we can see the following total sales:
1st half California total: 163,599
July and August: 35,000 average per month
September through December: 25,000 average per month
Total sales for 2008 estimate: 333,599
This isn’t such a far fetched number since last year 357,890 homes sold in the state. Now with that number established, let us look at current inventory.
I went ahead through some of the online MLS sources gathered data for the largest metropolitan areas in California, which cover the entire Southern California market, Bay Area, Sacramento, and the Northern and Central Valley. Unfortunately, this isn’t an exhaustive list leaving out certain areas like Redding and Eureka but overall it’ll gives us a solid snapshot:
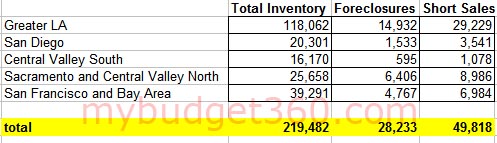
Let us first go over the chart above. Total inventory for these areas which covers the entire Southern California market including LA, OC, Ventura, the Inland Empire, San Diego, and also covers Fresno, Bay Area, the Central Valley and Sacramento areas gives us a total MLS inventory of 219,482. From this number, we see that across all these areas 28,233 homes are foreclosure sales meaning these are homes taken back by lenders and are now re-listed on the MLS and tagged as foreclosure resales. We also see that there are 49,818 short-sales meaning current owners have negotiated with current lenders to sell homes at a pre-agreed price to buyers assuming there is a buyer. These homes should they not sell will turn into foreclosures.
The problem arises however when we incorporate the foreclosure data released this month from Realtytrac:
July 2008 California foreclosure filings:
Notice of Defaults: 36,373
Notice of Trustee Sale: 12,506
REO: 23,406
So for our own purposes, for the month of July there should have been a jump in the foreclosure data by 35,912. What may be occurring is that REO numbers are not making it onto the MLS at the pace that lenders are taking these places back. As you can see from the above chart again, currently we have 28,233 foreclosed resale homes on the MLS for California as of this week yet last month alone, we had 35,912 homes being foreclosed on in California.
This causes even a bigger issue when we look at the June data:
June 2008 California foreclosure filings:
Notice of Default: 37,989
Notice of Trustee Sale: 10,053
REO: 20,624
We do not count Notice of Defaults because these properties are technically still owned by the current borrower although data for California is showing that less and less of these properties are being brought current. The vast majority are being foreclosed upon which only cements future inventory hitting the market. But given the 35,000 sale per month average, that means that 100 percent of the sale amount is being brought onto the market as foreclosed properties. This doesn’t even take into account the properties that are on the market that aren’t distressed. This of course is the bulk of the market.
Either way, you can clearly see that something is missing here. If we look at the C.A.R. data once again and the 7.7 months of inventory, we can derive that there are approximately 269,847 homes on the California market: 35,045 x 7.7 months according to their data. Yet that inventory number is assuming that the highest month of sales data, that of June – August will remain throughout the year which it will not. You can see with the chart that we constructed that over 80 percent of the market inventory is covered so we get a clear snapshot of what is occurring.
The purpose of this article is to simply highlight where the gap in data is coming from. The leak in they system seems to be the REO numbers. That is where the numbers are not making it into the MLS system. These are being kept in the lender’s own balance sheet yet make it very hard to predict what the actual inventory number is out on the market. What is certain is that the REOs are out there. Trying to figure out how this factors in with months of inventory is going to be a new challenge in the next few months.
If you enjoyed this post click here to subscribe to a complete feed and stay up to date with today’s challenging market! If you enjoyed this post click here to subscribe to a complete feed and stay up to date with today’s challenging market!
1 Comments on this post
Trackbacks
-
CPA, MBA said:
The listing inventory is property that is currently for sale. Bank owned property(REO’s) is property that will be listed within the next 12 months. There are also a large amount of homeowners who would like to sell for various reasons. If the inventory goes up(e.g. banks and homeowners put more property on the market), will the number of sales also go up? That is an interesting question. Who knows the future of the economy? There is little doubt that the government will inflate to pay off its debt, which will mean that real estate can be a hedge, once again.
June 18th, 2010 at 8:03 pm