Bread and Circuses – US Households Increase Debt in Wealth Destroying Areas: Mortgage Debt Holds Steady since 2008 while Debt in Auto Loans, Student Loans, and Credit Cards Reach Record Levels.
- 4 Comment
Americans for the most part generate their wealth via owning homes. Yet many younger Americans are having a tough time buying a home because of a crowding out effect from investors largely from Wall Street. I’ll start this post with some telling data: In 2008 US households had about $10 trillion in mortgage debt. Today it is $10.49 trillion for an increase of 4.9% over 13 years. Non-housing debt which is tied to wealth destroying items like cars, credit cards, and education (for some degrees) went from $2.64 trillion in 2008 to $4.14 trillion in 2021 (a 56.8% increase in the same 13 years). This is an important data point to understand since not all debt is bad. Getting a mortgage might be good since it forces you to save into your home which generally increases in price over time. However a car, credit cards to buy “stuffâ€, or getting a degree in a non-competitive major for $55,000 a year is all “bad†debt. You essentially have an item that goes down in value over time. So let us look at this data carefully.
Mortgage Debt and Non-Mortgage Debt
This chart is rather telling as it looks at mortgage debt (for the most part good) and non-mortgage debt (largely wealth negative):
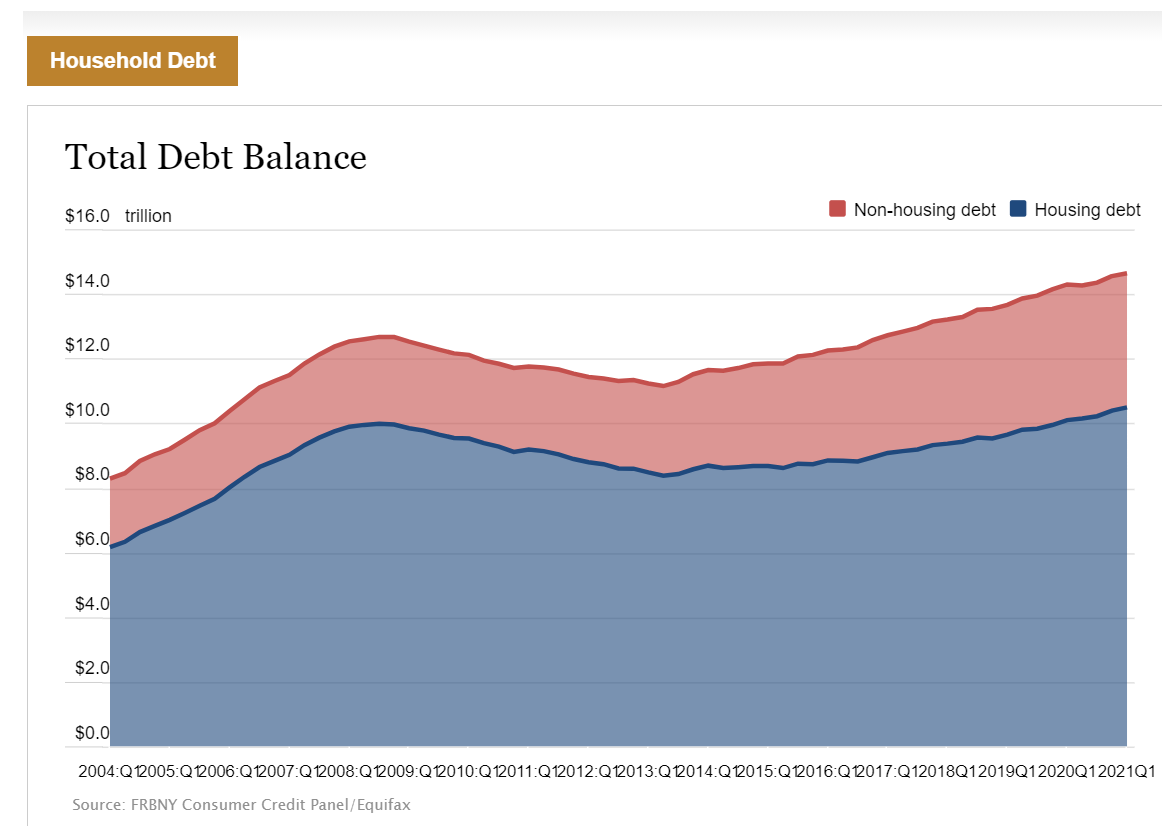
This chart is one of bread and circuses since 2008. In essence for 13 years Americans have not really increased their mortgage buying potential here (as evidence by lower homeownership by younger Americans). Yet at the same time, non-household debt has grown dramatically at this same period:
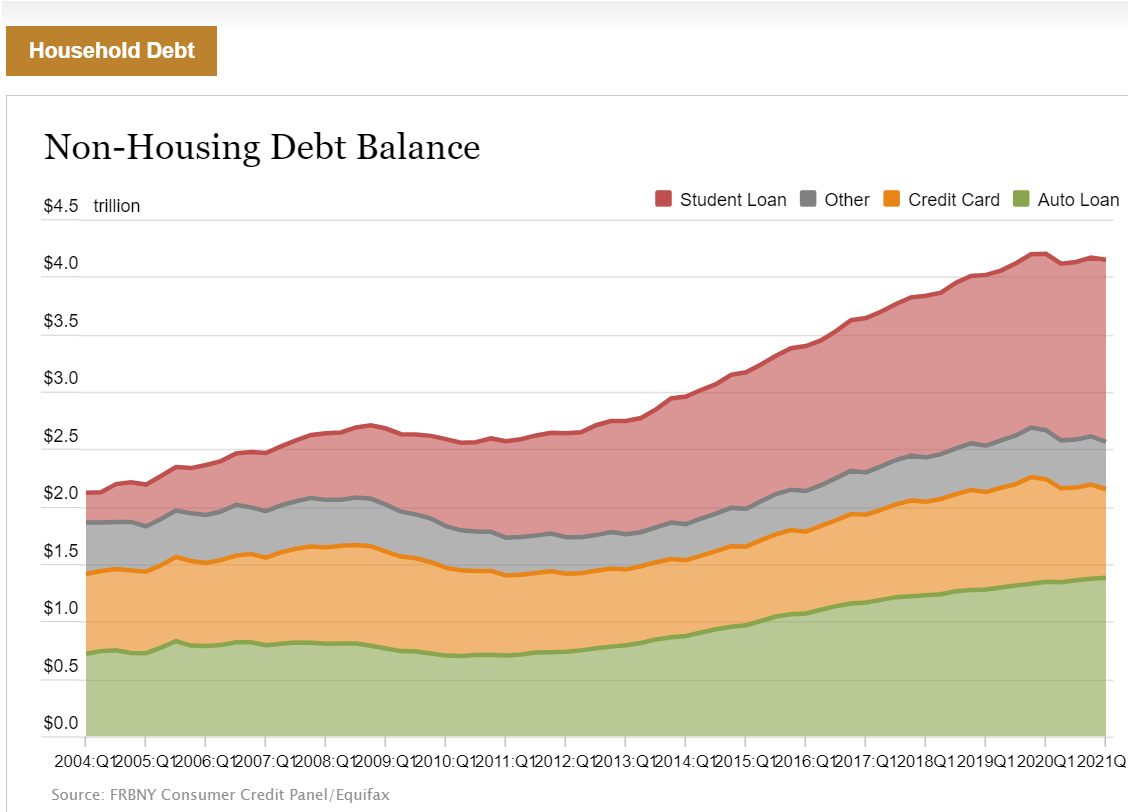
This is a bread and circuses narrative here – buy shiny things while time slips away. Student loan debt is crushing the balance sheet of younger American households. Of the $4.14 trillion non-household debt segment, the fastest growing segments are student loan debt and auto debt:
Student loan debt:Â Â Â Â Â Â Â Â Â $1.58 trillion vs $0.53 trillion in 2008 (198% increase)
Auto loan debt:Â Â Â Â Â Â Â Â Â Â Â Â Â Â $1.38 trillion vs $0.81 trillion in 2008 (70% increase)
So it is no shock that mortgage debt did the following:
Mortgage debt:Â Â Â Â Â Â Â Â Â Â Â Â Â Â $10.4 trillion vs $10 trillion in 2008 (4.9% increase)
So you have incredible growth in non-wealth building debt areas and mortgage debt is relatively stuck. But how are homes being bought? You have a large number of investors many from Wall Street buying up property and leveraging low borrowing rates to essentially turn many Americans into long-term renters. With very few areas to chase yield, investors are plowing into homes which were once the main pathway for Americans to build some level of wealth. But where are young Americans building wealth today? Crypto? Meme stocks? Those areas do not seem sustainable (there is something like 10,000+ crypto coins). 13 years is a long-time to get the ball rolling and on a 30-year mortgage, this means that only 17 years more would be on that mortgage if someone bought 13 years ago. Instead, many have okay cars, student debt, and credit card debt but in the end, that is not wealth producing.
So while the stock market is at a record high (only half of Americans even own one stock) and real estate is at record levels (homeownership is down from record levels and weak for younger Americans) we are seeing where the money is flowing.
Still not convinced? Just look at income growth over a generation:
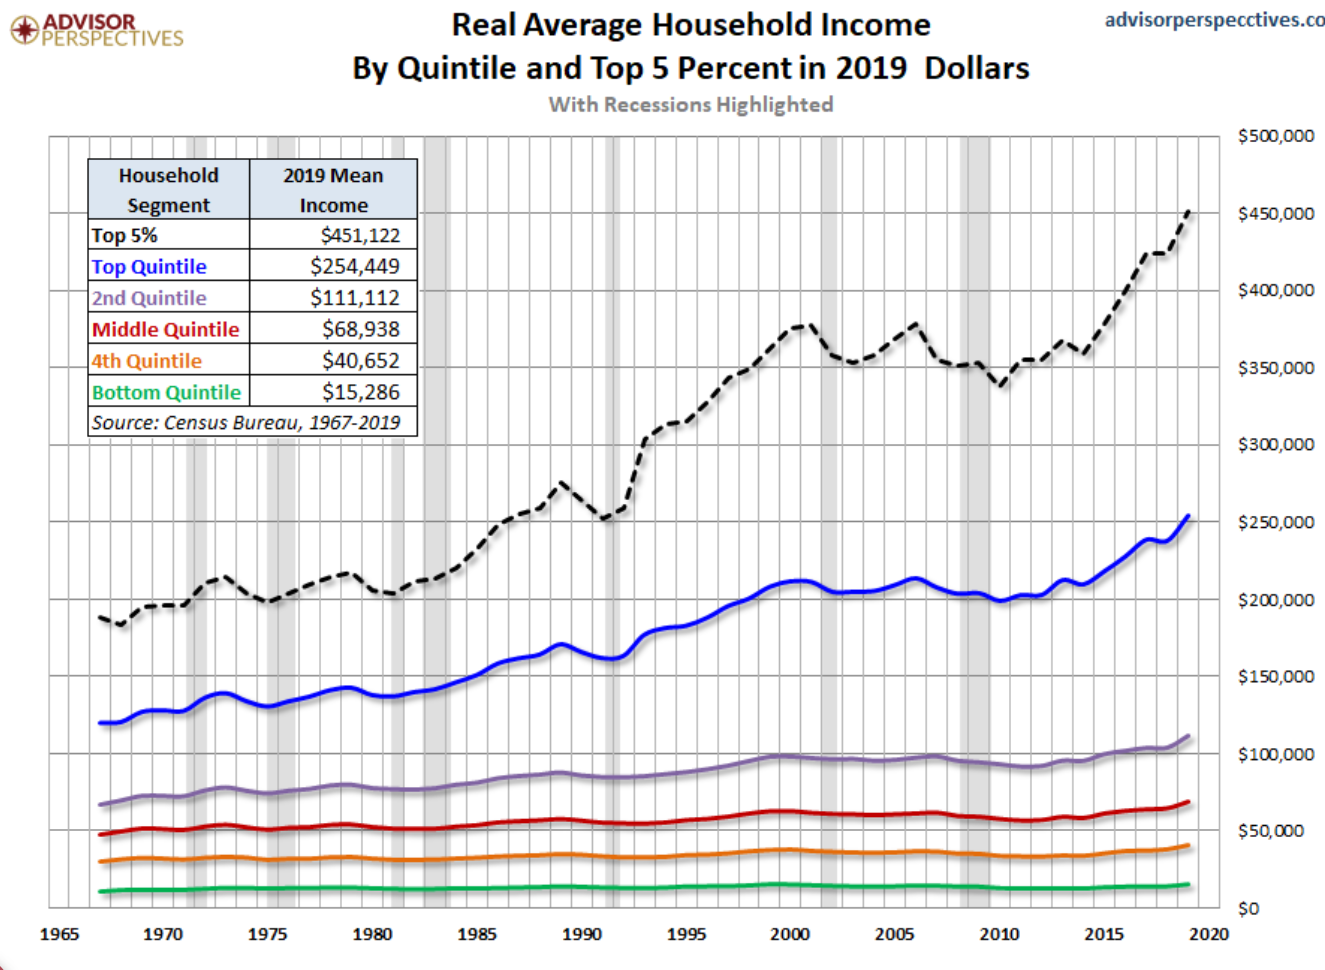
The only group that saw real inflation adjusted income growth is the top 20 percent (and more to the point, the top 5 percent). And you wonder why the middle class is being hollowed out.
If you enjoyed this post click here to subscribe to a complete feed and stay up to date with today’s challenging market!4 Comments on this post
Trackbacks
-
Scott said:
I’m confused…
The last part of the article stated, “The only group that saw real inflation adjusted income growth is the top 20 percent”. I’m not arguing the problem, but the comment seems in conflict with the chart. The chart states “Real Average Household Income…in 2019 dollars.”
The way I read the chart is that every quintile saw an increase in “Real” income. Real income in 2019 dollars means inflation adjusted. I completely agree the income increases are unevenly distributed however according to the chart every quintile saw a “Real” increase. When you factor in many households have two wage earners, it’s particularly bleak for the bottom 60%.
July 4th, 2021 at 10:43 am -
Jeff Martin said:
Don’t worry, big hedge funds will buy your house when you go bankrupt and rent it back to you, making you their serf. Or they will sell it to the ChiComs for their immigrants when America falls. By September…
July 4th, 2021 at 1:14 pm -
Occams said:
‘What could go wrong’?
July 4th, 2021 at 4:37 pm -
Sebastian De Bergerac said:
This trend is alarming! These young adults will eventually be wards of the state since they will be behind financially. It is even more alarming that as they are paying loan payments in their working years that is money that could have been put away for retirement. Thus, guaranteeing that they will indeed be wards of the state. I wonder if they will lean more to the left because they feel the capitalist system has abandoned them. I know many co-workers (I work at a hospital as a nurse) have over 60,000 dollars in debt for a measly nursing degree. Some have over 120,000 dollars in debt for a bachelors. Then once they are nursing the medical community pushes further education such as useless masters degrees. Hence, perpetual debt slaves. Idiots with little to no financially education.
July 10th, 2021 at 1:31 am