Casino economics: How the S&P 500 endured two 50 percent dips in the 2000s and sent the middle class packing.
- 3 Comment
It took the S&P 500 about 13 years to get back to where it was in 2000. Of course the power of inflation has taken an even deeper toll on this trend. The stock market is largely a spectacle for most average Americans. It is a dramatic sideshow like going to the track and betting on horses. The reality is, most Americans do not own any sizeable amount of stocks. 1 out of 3 Americans have no savings and about half of Americans are one paycheck away from being on food stamps. By the way, 47 million Americans are still on food stamps in this recovery. The stock market over the last few decades has operated like a casino swinging from one bubble to another. After every subsequent bust, middle class households have seen a chunk of their standard of living diminish. This is not hyperbole because simply looking at Census data, adjusting for inflation median household income is back to where it was in the mid-1990s. In fact, the S&P 500 has endured two dips of 50+ percent between 2000 and 2010, both precipitated by bubbles. Can the average American compete in casino economics?
The big dips
The S&P 500, a much better of stock wealth in the US than the DOW has seen some major volatility in the last decade:
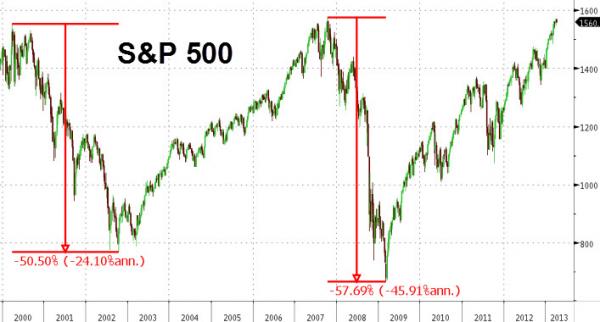
Source:Â ZeroHedge
This is an interesting chart. The dip in the early 2000s was led by the tech bust and the recent dip was brought on by the massive housing bubble. The Federal Reserve is back at it inflating their balance sheet to over $3.1 trillion buying mortgage backed securities as if it were a clearance sale. Yet the market being up is a good thing for Americans, right? Well a big part of the gains has come from cutting wages and squeezing productivity of remaining workers. Wealth inequality in the US is now reviving memories of the Gilded Age.
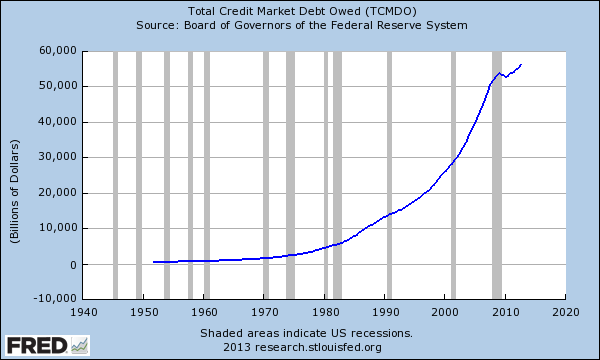
What is underlying a large part of this growth is massive debt expansion. We are quickly on our way to approaching a total credit market of debt of $60 trillion. The recession barely stunted this path:
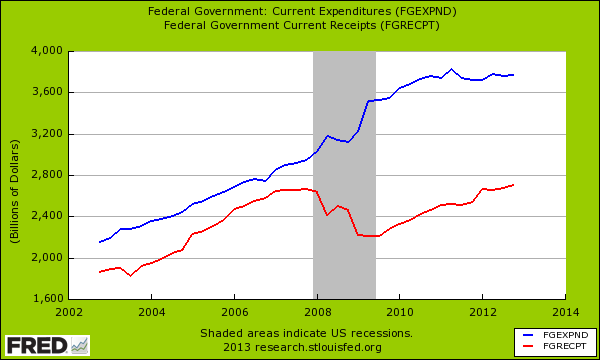
Those who can get their hands on debt are buying things up from real estate to other investments. Banks are leveraging up and bonuses are back in fashion. The government continues to spend way more than it is bringing in:
Yet the Fed is also allowing banks to leverage back up and go back into their black box models of investing. It seems like a large portion of the population is simply not interested in why the financial crisis took place. Our politicians are certainly not interested and prevention is rarely a good selling point.
The stock market is operating under a system of casino economics. A boom and bust system is nearly inevitable with the Federal Reserve flooding the market with cheap interest rates. Yet using the word “market†may not be right here. They are providing member banks with easy money to speculate. The public is actually seeing tighter standards on lending:
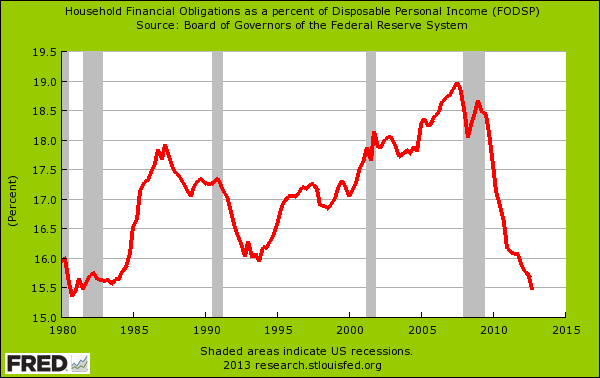
A big part of this adjustment has come from foreclosures but also a tighter credit market. From the first chart regarding total debt outstanding, you realize that what applies to the average household is not the norm. I’m sure many people look at the stock market and think about buy and hold philosophies. Yet the market stands today where it did in 2000 (actually lower if we adjust for inflation). Unfortunately the market is setup for boom and bust cycles and those that create them are usually the people that profit. Take a look at Japan for a case in long-term quantitative easing after a housing bust. Ironically, some of the banks that caused the housing bust are now using cheap Fed money to buy up properties as rentals or for other investment ventures. This is simply part of the plan in casino economics. The house always wins.
 If you enjoyed this post click here to subscribe to a complete feed and stay up to date with today’s challenging market!
If you enjoyed this post click here to subscribe to a complete feed and stay up to date with today’s challenging market!
3 Comments on this post
Trackbacks
-
William @ Bite the Bullet said:
Good points. But this time round, there may be something not present in the previous two spikes: value. If you look at the PE ratio of the S&P 500 (http://bit.ly/SP500PE) you can see the PE spiking before the previous two crashes. At the moment, though, the PE is nowhere near a spike (at least not yet).
April 4th, 2013 at 8:16 am -
Mark said:
Excellent point William…..maybe our esteemed blogger could make this a topic matter coming up?
April 5th, 2013 at 11:58 am -
hilly said:
It is now a game with no players.
All markets are manipulated and
nothing is real anymore. Time to
step aside and prepare for the worst.April 7th, 2013 at 8:10 pm