Dow Jones Industrial Average on Pace for top 3 Worst Performing Year since 1896: Understanding one of the Most Followed Industrial Averages.
- 0 Comments
The Dow Jones Industrial Average (DJIA) is closely followed by those here at home but also those around the world. It is the oldest continuing U.S. market index. The DJIA is the best-known market indicator simply because it has one of the longest histories and many have grown accustomed to following the index. Since the U.S. Treasury and Fed want to punish savers and force people into the markets or to spend, it is important to understand what moves the markets. There are many indicators that give a better overall glimpse of the market yet the DJIA is still closely followed.
The DJIA started out with only 12 stocks back in 1896 which then grew to 20 in 1916. The now typical 30-stock average started in 1928 only one year before the Great Depression. The 30-stock average has stayed with us ever since.
The DJIA stocks are picked by the editors at The Wall Street Journal.  The stocks are chosen for market scope and importance yet certain circumstances may cause changes. For example, the implosion of AIG led to it being replaced by Kraft. Now some would argue that this would skew the data and in fact, looking at the DJIA in relation to other global market indicators, it would appear that this does occur. This is partly a reason why more people may follow the S & P 500 or Nasdaq for a better overall picture of what is happening in the U.S. economy.
Some stocks for example like General Electric have been on and off the DJIA. It was one of the original 12 stocks but was taken out in 1898. One year later it was put back in, taken out in 1901 and then put back in 1907. Since then, it has remained part of the index.
The importance of understanding the history here is that the DJIA is now closing in on one of its worst performing years on record:
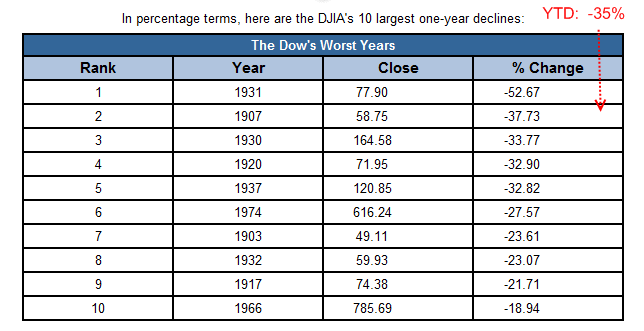
Just to give you a perspective, this will very likely be the worst year on record since the Great Depression. The DJIA is currently down 35% for the year with only a few more trading days to go. We are looking at a top 5 year even with a short-term rally most likely. If the DJIA drops 3% more, it will place it as the 2nd worst year on record. Out of the top 10 poorest performing years, only 2 occur after World War II. That is why when I give 10 reasons for this being the worst recession since the World War II, we are also looking at historical context. The market is facing a very challenging time. In addition, the removal of AIG has skewed the data a bit so we are very likely facing the 2nd worst year on record here.
The point should be made that market volatility is not a good sign. Let us look at days with the greatest percentage gain:
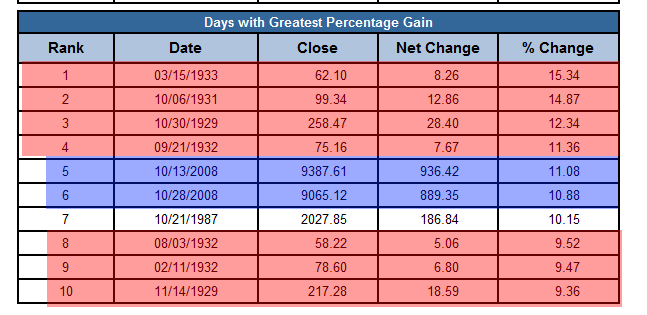
The above should be a very telling chart. 2008 is the most volatile year out of the top 20 days with the highest percentage gains. The other point in history with this much volatility occurred during the Great Depression.  Take a look at the biggest down days:
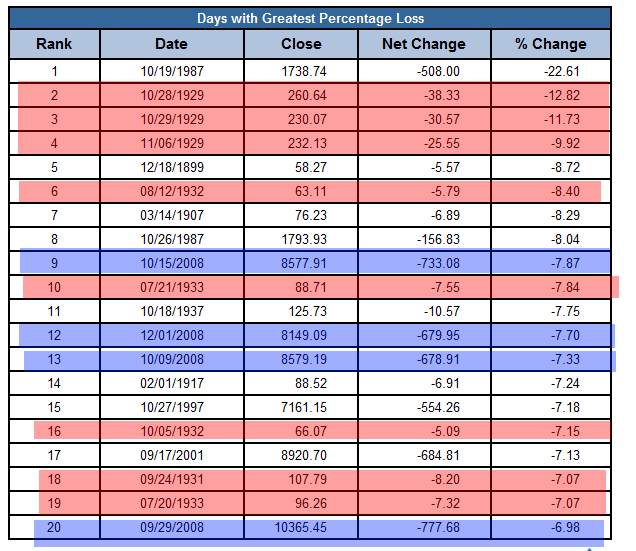
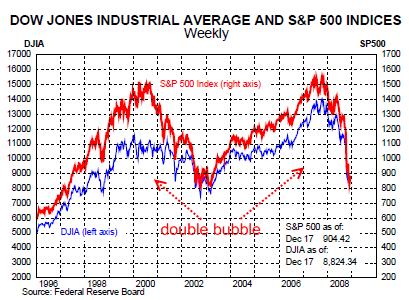
This is not good company. On the surface you would think that having stunning rallies is great but it is merely a reflection of the extreme market volatility that is hurting the current market. Typically, what most investors want is a stable market (at least investors who are concerned with sustainability). What we have had with the DJIA is two bubbles. First, the technology bubble and then the real estate bubble. If we look at the chart over the past 12 years, this double bubble becomes apparent:
So why is the DJIA hurting so much this year? A large part of the 30-stocks are finance and banking related:
American Express, Bank of America, Citigroup, and JP Morgan Chase.
If you throw in AIG which was on the index for a large part of 2008, you get a better picture of what is happening. The DJIA has a lot of history and given its historical nature, it plays both a psychological role in reflecting the state of the current troubled economy. If we look at the above data we need to ask whether this market will recover quickly, or will this be something more sustained and long-term? Only time will tell.
If you enjoyed this post click here to subscribe to a complete feed and stay up to date with today’s challenging market! If you enjoyed this post click here to subscribe to a complete feed and stay up to date with today’s challenging market!