Are we missing critical inflation data with the CPI? How the government over time has altered the CPI to under report inflation.
- 2 Comment
Most Americans realize that their standard of living has decreased. Many realize today that their dollars do not go as far as they once did. We try to reflect this data via the Consumer Price Index but over the last few decades, this index has been adjusted to suit the needs of those producing the data or more to the point, those in power. A measurement is only as good as its ability to accurately produce valuable data. The CPI has been altered many times over the last few decades and we’ll discuss how this measure no longer reflects real underlying inflation. You need only look at your underlying budget to realize that somehow, your money is not going as far as it once did. Yet the CPI data tells us that inflation is hardly any concern in the current economy. Let us examine a little bit of history with the CPI.
Inflation over time
We have had many periods of severe inflation and deflation well into the 1980s. Somehow, in the 1980s we seemed to get inflation under control:
Ironically much of this “control†came in the early 1980s with some minor adjusting of the CPI. The biggest change was with the addition of the owners’ equivalent of rent measure to replace housing costs. There are major issues with this approach. This change started looking at supposed market rates instead of actually looking at the true cost of owning a home. The BLS asks the following question:
Consumer Expenditure Survey asks of consumers who own their primary residence:
“If someone were to rent your home today, how much do you think it would rent for monthly, unfurnished and without utilities?â€
The following questions, asked of consumers who rent their primary residence, are the basis of the weight for Rent:
“What is the rental charge to your [household] for this unit including any extra charges for garage and parking facilities? Do not include direct payments by local, state or federal agencies. What period of time does this cover?â€
Do you see the problem here? How in the world would a person know their real market rents without actually renting the place out? Also, what if you pay $3,000 a month in total housing costs while the place can only rent for $2,000? For renters, you know your market rent because you are actually paying it. Prior to this people reported what they were paying for their actual home and not treating their primary residence as some hypothetical rental. This change alone started to down play inflation since housing is the biggest expense for Americans and rent is typically cheaper than owning.
You can see how badly this change missed the entire housing bubble:
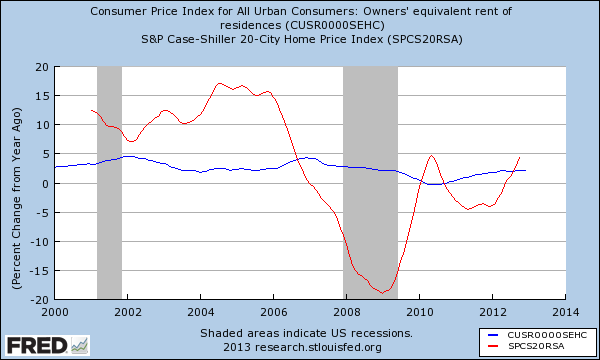
According to the CPI, the OER measure was reporting increasing home values but only slightly. During the entire housing bubble, never did the OER go over 5 percent on a year-over-year basis. However, looking at the Case Shiller Index we see that home values were going up by double-digits on an annual basis all the way until the bubble burst in 2007.
The above should be a clear example of why we should opt out of the OER yet as you see in the first chart that would likely mean that the real inflation rate is running much higher. So of course there will be no adjustments.
A few other notable changes to the CPI have occurred:
-Later, a change to substitution was added (i.e., if steak becomes too expensive, then people opt for chicken).
-If there is a cheaper outlet, people will opt to shop there (i.e., Wal-Mart).
-Quality improvements offset price increases (like GPS in cars).
Every additional change of course begins to reflect a basket of goods that does not represent reality. If we continued using the 1982 method of calculating the CPI, inflation would be above 9 percent today. That is a major difference from where we stand today. It would also reign in the Federal Reserve and their $3 trillion balance sheet when they point to inflation being modest as a reason for their continued monetary policy. It is interesting that the biggest miss of the last decade was the housing bubble and the OER was a big reason it was underreported. In fact the Fed used the CPI as a reason to justify lower rates. “Hey, see here with the CPI, no inflation in housing!â€
Ultimately inflation is hitting with wages back to 1990s levels and costs soaring for tuition, healthcare, and once again, housing. Of course the CPI isn’t showing this but you should look at that data a little more carefully and keep the above changes in mind.
 If you enjoyed this post click here to subscribe to a complete feed and stay up to date with today’s challenging market!
If you enjoyed this post click here to subscribe to a complete feed and stay up to date with today’s challenging market!
2 Comments on this post
Trackbacks
-
TrapperGus said:
Some counter comments…
Regarding the selling price of real estate verses the overall costs of owning or renting…the price of real estate at a point in time is not the cost of buying real estate…the interest rate, other borrowing costs and the monthly payments which can be modified depending on the length of the loan of course are in play. Also real estate is a long term investment so the current price does not reflect what a majority of people are paying monthly since most of those people bought as far back as 30 years in the past. The number the BLS is using may have error but comparing it to the current price of real estate is also an error and a much larger error…
Also the “Steak’ to “Chicken” canard is exactly that. What you are talking about is the chained CPI-U (C-CPI-U) which is not used for the CPI-U….BLS does maintain the C-CPI-U but that is not the number reported.
And the CPI-U is measuring prices. If prices are lower due to effective management of the supply chain, for example WalMart, then that does count as a lower price and should be reflected in the CPI.
January 31st, 2013 at 6:04 pm -
TrapperGus said:
Sorry for a double comment but I didn’t realize you were using John Williams numbers…having reviewed his methods in detail from what can be determined from his Web page postings he is making major errors in the numbers he is reporting…
The most significant error is that he reports his cummultive inflation number on a graph showing the BLS annual inflation number…meaning if inflation was 2% for 10 years his number would show 20% inflation in the 10th year while the BLS number would show 2% for each year…he makes other more odd errors in his calculations but unless you know that he is showing you two different things for his number verses the BLS number you will think that inflation as he measures it is hugely higher…it is not…maybe about 0.25% annually higher but not more…
January 31st, 2013 at 6:11 pm