How much do average Americans make after the Great Recession? Examining the income of U.S. households. 65 percent of U.S. households live on $65,000 or less.
- 8 Comment
In order to understand the middle class, we first have to draw a line in the economic sand. Many in our society would like to believe that we live in a classless system but this isn’t true especially when we look at the financial data. This classless belief has been shattered with the current structure of the banking bailouts that have favored the top 1 percent in our country. I wanted to update some of the data that I had posted back in December of 2008. There is something fascinating about looking at aggregate income data because it tells us a lot about our financial condition. Yet whenever we hear debates about the middle class, rarely does anyone talk about the specific income cutoff.
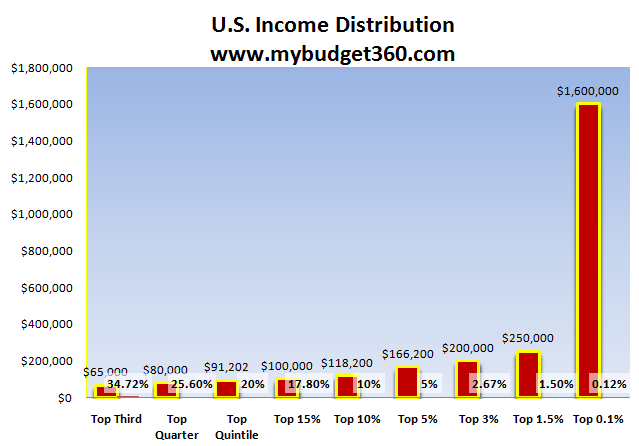
Let us first examine the top 35 percent of households:
Source:Â Census
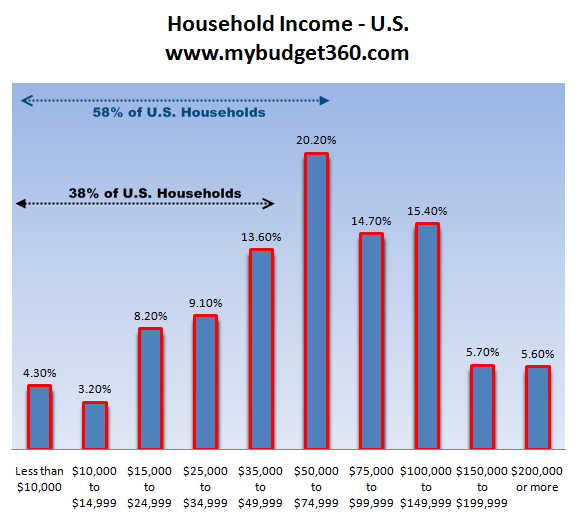
If a household brings in $65,000 or more they have made it into the top 35 percent of affluent households. Now this may not seem like much to a large number of middle class Americans given the rising cost of goods over the last few decades. To make it into the top 1 percent a household would need to make more than $250,000 per year. To be in the top 0.1% a household would need to make more than $1.6 million. This data distribution was from 2007. I managed to find more recent Census data from 2008 and put together an updated chart to shed a different perspective of the middle class. The below chart is more realistic because it goes from 0 to $200,000 and since most people fall along this spectrum the information might be more useful and applicable:
38 percent of U.S. households make $49,999 or less. When we talk about the 40 million Americans receiving food assistance this is where we are looking. If we look at household incomes of less than $74,999 we cover 58 percent of all U.S. households. The actual median household income in 2008 is $63,000 according to the American Community Survey done by the Census. We’ll have more updated information in September of this year with data for 2009.
The above chart helps highlight the cutoff points for middle class Americans. In recent debates, we have seen that those who make $100,000 or more have somehow made this seem like the de facto income in America. Even at this level, only 20 percent of U.S. households make $100,000 or more. This is high relative to what many Americans are working with. Yet I think many in the media since they fall in this range seem to project their own income situation onto the public discourse. If they would only look at the above data they would find out that middle class Americans have to get by with much less in today’s market.
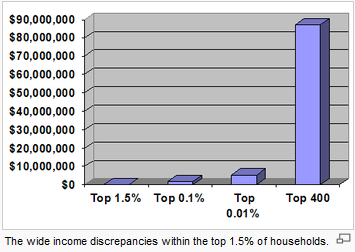
A household that makes more than $200,000 is in the top 5 percent of our country. Yet even that isn’t enough to put them in the top 1 percent that control 42 percent of all financial wealth. But even within the top 1.5 percent income variation is enormous:

Source:Â Wikipedia
“As of 2005 there are approximately 146,000 (0.1%) households with incomes exceeding $1,500,000, while the top 0.01% or 11,000 households had incomes exceeding $5,500,000. The 400 highest tax payers in the nation had gross annual household incomes exceeding $87,000,000. Household incomes for this group have risen more dramatically than for any other. As a result the gap between those who make less than one and half million dollars annually (99.9% of households) and those who make more (0.1%) has been steadily increasing, prompting The New York Times to proclaim that the “Richest Are Leaving Even the Rich Far Behind.” Indeed the income disparities within the top 1.5% are quite drastic. While households in the top 1.5% of households had incomes exceeding $250,000, 443% above the national median, their incomes were still 2200% lower than those of the top .01% of households. One can therefore conclude that almost any household, even those with incomes of $250,000 annually are poor when compared to the top .1%, who in turn are poor compared to the top 0.000267%, the top 400 taxpaying households.â€
I guess many things are relative when it comes to income. True wealth is actually measured by net worth. In 2009 the number of millionaire households jumped to 7.8 million but this is down from the peak of 9.2 million in 2007. This recession has destroyed a lot of wealth and the middle class have seen a longer journey ahead if they ever wish to reach financial security. But this isn’t a new trend and this recession has only brought the issue of economic class to the forefront.
If you enjoyed this post click here to subscribe to a complete feed and stay up to date with today’s challenging market!8 Comments on this post
Trackbacks
-
Dead End said:
Nice piece, but it does nothing to addess costs of living, which are dramaticlly different between Los Angles, Ft Wayne IN, Washington DC or Highpoint NC.
April 27th, 2010 at 4:00 am -
steve bourg said:
Gobt workers are starving the private sector ‘beast’. A policeman in NYC can have a 20-yr career, make $2M over the 20, get health-care worth $350k more, and then at age 42, retire with promises of $3.5M more over the next 40 years until age 82, an approx life expectancy. That’s $6M over 20 yrs worked = $300k/yr worked. And they’re easily, at age 42 net worth millionaires worth about $2M-$3M of future present value promises, pension and health-care. That goes on from every city around the country, that fiscal insanity. Check out http://www.nypdrecruit to verify my #s. Taxpayers are getting pasted by the new, most common millionaires — govt workers. Therefore,and a by-product of my point — is that your ‘income-distribution’ chart is misleading in terms of being, as it is, direct currrent income. Benefits are egregious in the govt sector, and they are not taxed over the working years, which makes them incredibly tax-efficient, but also a disaster for many reasons.
April 27th, 2010 at 4:08 am -
John said:
I make $265K and single but I don’t feel rich or wealthy whatsoever. The way things are going, I don’t think social security is going to be there for me when i retire and the returns in the market are not going to be like before the great recession!.
April 27th, 2010 at 7:48 pm -
Henry Dandolo said:
Its amazing that this income disparity continues without abation. People who think they are rich will found out they are quite poor, even poorer than the poorest homeless vagrant they step over and snort at – today – come tomorrow.
Its been helped by those who criticize unions in hopes of changing public opinion on ‘benefits’ but it looks like full steam ahead for unions in the next 6 years as a way to claw back from the >$87,000,000/yr club.
And yes, higher taxes coming for all you John Gault worshippers (where you gonna move to, Costa Rica? Good, we could use less idiots).
Either you pay it back, or default. Deficits don’t matter and corruption is coming home to roost.
April 27th, 2010 at 9:00 pm -
Serge said:
I agree with Steve Bourg. Government needs to shrink. And fast. Unfortunately most people don’t realize how expensive government really is. They don’t realize that this huge morass is choking the productive private sector. The median income for a government employee is now 73% higher than the median income in the private sector. And the private sector is footing the bill. And the numbers of government employees is expanding at a rapid pace. And I haven’t even touched the benefits. Steve did mention healthcare and pensions. It is a crisis that needs to be addressed, yet it seems there are only a few people that understand.
May 7th, 2010 at 11:56 am -
Anne said:
Serge and Steve – Just where are you getting your information that government workers are so overpaid? That 73% is pure bunkum. Just a few short years ago, government couldn’t compete with salaries in the private sector, and it was hard to both attract new employees and to retain old ones. Some salaries were raised, but no one is making 73% more than comparable private sector employees.
As for Steve’s example of NYC police officers…. Well, $2 million over 20 years comes out to an average of $100,000 a year at current pay levels. And current top pay is just under $91,000–including benefits but not overtime–so the $2 million is a bit of an exaggeration. Do those figures represent such a fabulous income for someone who, first, lives in a high cost-of-living city and, second, does a dangerous job? How many fewer police officers would you like to have in NYC, BTW?
Further, according to salary.com, the MEDIAN expected salary for a typical police officer in the United States is $49,991. Not exactly a fortune.
And, Serge, exactly which government employees do you want to get rid of? Who will do the work that needs to be done. Oh, yeah, we can follow the Cheney formula and contract out to private firms. Sure, that will really save money. Any money that actually is saved–and it won’t necessarily be saved–will be taken out of the hides of the workers. After all, private corporations need to make profit. Nothing wrong with profit but there’s no way a public service can be provided more cheaply by a private company that needs to make that profit unless it cuts wages/salaries and benefits for workers. That’s exactly why a certain sector wants to privatize education. It’s not about better serving children or saving money for the taxpayer. It’s about killing the unions, paying teachers less, and raking in money from taxpayer dollars that then go to private entities, where the executives are the ones most likely to benefit from high salaries and good benefits. One of the companies that claimed they could provide better education more cheaply than public schools needed $5,000 a year per pupil extra above what the public schools received to do a comparable job. In what way is this cheaper?
I really don’t understand all the folks who seem to begrudge workers and middle class employees, public or private, decent salaries while never blinking at the fact that those at the top keep taking a larger and larger percentage of all income as each year passes. The share of total U.S. income made up by the top 10 percent of earners, according to Saez’s figures, was around 35 percent in 1987. By 2007, the top U.S. earners would capture almost 50 percent of total U.S. income.
The share of total U.S. income made up by the top 10 percent of earners according to reseach by Berkley’s Emmanual Saez was around 35 percent in 1987. By 2007, the top U.S. earners would capture almost 50 percent of total U.S. income. (Steve – how many cops nationwide do you think are among that top 10 percent? Probably a few in high cost-of-living places like NYC and LA, but the rest?) Even these figures, though, are distorted. To be in the top 10 percent, as indicated by the chart above, one needs only an income of $118,200, not all that far from the median income in 2007 of just over $50,000. The real discrepancy is what is taken in by the top .1%. Or even the top 1%. In 2005 the top 300,000 in the U.S. together had almost as much income as the bottom 150 MILLION together. Let’s see–300 THOUSAND compared to 150 MILLION. H-m-m.
Government employee wages and salaries are NOT the problem.
May 11th, 2010 at 3:46 pm -
Maria said:
If an individual makes 100K a year, she is in the top 5% of jobs. This is distinguished from the data for households which includes two earners.
Good point on the present value of government pensions. You taxpayers will have to pay for it, unless your city or county goes bankrupt like some counties and cities in California did over government pensions. States can not go bankrupt.
October 19th, 2011 at 5:53 pm -
Jose G Plumey said:
great article, it really shows the great disparity that e expense, encounters us all. I agree with some of the comments made, especially the cost of living I would like to see a comparison of wages vers cost of living, thanks
November 25th, 2019 at 10:05 am


 If you enjoyed this post click here to subscribe to a complete feed and stay up to date with today’s challenging market!