How much do Americans earn? What is the average US income and other income figures. Fiscal cliff talks only useful in context of incomes.
- 24 Comment
With talk of the fiscal cliff taking up most of the headlines it is probably useful to look at income figures for Americans. The media rarely discusses income because it is a touchy subject. It probably would not be savvy in a marketing sense to tell viewers that their incomes have been stuck in the financial mud for well over a decade. Household incomes in the US have been stagnant for well over a decade. Real income growth has largely occurred in the top 10 percent of US households. This is why we are seeing the middle class shrink in our nation. Over 47 million Americans now rely on food stamps. It would be useful if all this talk about the fiscal cliff actually examined the nuts and bolts of US household income.
US median and average household incomes
First we should examine some data from the latest Census figures:
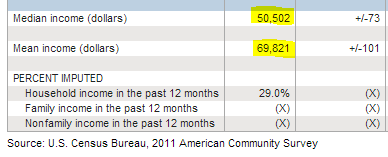
Source:Â US Census
The median household income in the US is $50,502. This is some extremely useful data given that it is exploring over 114 million US households. If you want to know how most Americans are living this is a good figure to base your assumptions. $50,000 does not go a long way in our economy today given the cost of food, energy, housing, education, and healthcare.
The average US income is a less useful measure because it is skewed by high income households and mega income earners. According to Social Security tax records for 2011 you have 93 Americans making more than $50,000,000 with average earnings of $79,000,000+. Clearly this pushes the average much higher and that is why you see the average household income at $69,821.
Breaking down US household income by category presents a clearer picture:
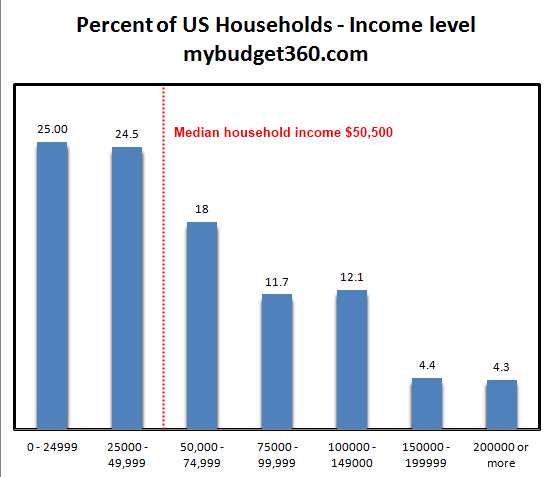
Source:Â US Census
20.8 percent of US households make $100,000 or more. Only 4.3 percent make more than $200,000 and roughly 2 percent make more than $250,000. Given all the ads you see on network TV you would think that every other US household was pulling in $200,000 a year given the kind of products that are pushed. Of course most of the goods bought in the last decade were financed with massive debt and not actual saved wealth.
Where did income grow?
US income growth has been absent for most households. In fact, over the last four decades most of the real income growth has occurred for the top 10 percent of US households:
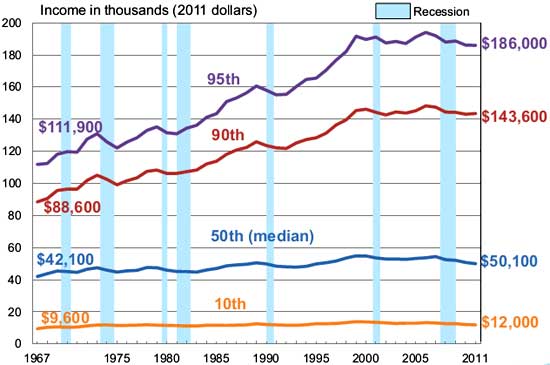
The typical family barely saw any real income growth and that is why many feel a true pinch to their wallet. Yet household incomes for earners in the top 10 percent saw real sizeable growth over the last four decades.
I’m not sure if Americans are fully aware of these income figures. Let us look at some data from the Social Security Administration:

According to Social Security tax records for 2011:
151,380,749 wage earners (had earnings in 2011)
50 percent of US wage earners made less than or equal to the median wage, estimate to be $26,965
66 percent of US wage earners made less than or equal to $41,211.36
This information is at a granular level but extremely helpful. Since everyone pays into the Social Security system, this is a good sense of how many people are earning income in the US. According to this information 151 million Americans earned some sort of wages or compensation in 2011. The median wage in the US per person is $26,695. This tells us a lot since the median household income is at $50,500. Since the Census data looks at households, this data hones in on individual wage earners. 66 percent of Americans earn less than $41,212.
It is important to understand the income breakdown in the US before fully appreciating the fiscal cliff talks. After all, the biggest driving force for most Americans is their paycheck so it pays to understand this data fully.
If you enjoyed this post click here to subscribe to a complete feed and stay up to date with today’s challenging market! If you enjoyed this post click here to subscribe to a complete feed and stay up to date with today’s challenging market!
24 Comments on this post
Trackbacks
-
Ulysses said:
Since 1971 the purchasing power of a dollar has gone down by 90% so measuring income in terms of fiat dollars is totally meaningless. What is truly important is what you can buy with it. Converting the “income” numbers into loaves of bread, pounds of meat or gallons of milk and gasoline is the realistic measure of wealth.
December 31st, 2012 at 9:34 pm -
RUSS SMITH said:
HAPPY NEW YEAR PATRONS OF MY BUDGET 360 ET AL:
How long will the American people replace reality regards their incomes with mumbo jumbo statistics rather than understanding the buying power of their money whatever its’ sources?
In his book, The Trimph Of Gold, published in 1987, Dr. Frantz Pick refers to the US $ as the mini-dollar which refers to the $’s sliding scale bying power being lost through inflation over time.
The American Institute For Economic Research, (888)528-1216, has produced their Chart Book which depicts the purchasing power of the US $ as their 1st chart. There were times when the US $ backed by gold represented around 140 cents in buying power but, after President Nixon closed the US Gold Window on August 15, 1971 fell in purchasing power down to around 2 cent today. This is why Dr. Pick refered to the US $ as the mini-dollar.
To restore the $’s purchasing power would require a massive deflation or destruction of trllions of US $’s but the US monetary systems Central Control.The Federal Reserve, fears a deflation which they believe caused the Great Depression and so it has turned its’ focus upon QE (Quantitative Easing which is a phrase substituted for inflation) as its’ substituion for another depresssion attempting to artificually stimulate OUR US economy out of recessions. The results of their monetary easings is inflation which causes the US $ to loose further purchasing power over and over again ad infinitum.
The US Constitution in Article 1; Section 10 calls for all US citizens to use only specie gold and silver coins as money. To make this possible for all US citizens across the board, the repository gold in Fort Knox, Kentucky and elsewhere would need to be minted free of charges including no commissions into gold coins distributed to all citizens of the US or OUR present inflationary condition will continue to worsen until?
Dr. Mark Faber makes his statement regards his estimate of the price of gold @ the National Inflation Association’s website within their almost 1 hr. film, MELTUP. He says that gold’s price would need to be fixed @ $1,000,000 per troy oz. but his statement is back several years which means his estimate should be higer; sense the total monetary base has moved much higher after he made that statement. How hight that price should be is anyone’s quess and it can only climb while the Federal Reserve continues to issue more inflationary purchasing media which constantly devaluates the purchasing power of the US $.
We the people of the US are in an economic pickle and ONLY we the people can take the steps as outlined within OUR Constitution which will elevate our lives out of this monetary pickle whenever we finally decide we have had enough of the forces that are destroying OUR American way of life ASAP.
In conclusion, if you make $1,000 a day, when the US $ was worth 140 cents, your buying power that day would be 140,000 pennies. When that was possible gas was selling for around $.29 per gallon. If you earn today $1,000 @ 2 cents per $ you only earn 2,000 pennies a day with gas @ around $4. So it would appear that, according to the $’s benchmark buying power status, as the number of $’s you earn goes up your bying power goes down doesn’t it? Thus, Dr. Pick reflects upon the US $ as a wasting asset which he calls the mini-dollar.RUSS SMITH, CA (One Of Our Broke Fiat Money States)
resmith@wcisp.comJanuary 1st, 2013 at 1:59 am -
Hillary said:
it is interesting when it is broken down like that. I didn’t realize that had the median set so high. It is quite weird to me that it is that high. That can’t be the real average, can it?
January 1st, 2013 at 7:11 am -
Michael said:
Russ: you state that the US Constitution is Article 1 Section 10 “calls for all US citizens to use only specie gold and silver coins as money”. That is not correct. Article 1 section 10 states the following regarding gold:
“No State shall enter into any Treaty, Alliance, or Confederation; grant Letters of Marque and Reprisal; coin Money; emit Bills of Credit; make any Thing but gold and silver Coin a Tender in Payment of Debts; pass any Bill of Attainder, ex post facto Law, or Law impairing the Obligation of Contracts, or grant any Title of Nobility.”
That is why there is not a currency of Pennsylvania or of North Dakota; they may not create their own. They can’t print money. This clause does not prevent the federal government from doing so, though.
May 16th, 2013 at 5:56 am -
Kevin said:
Michael:
The Federal government does not print our currency. The Federal Reserve Bank does, and the Federal Reserve Bank is no more an entity of the US government than Federal Express is an entity of the US mail service. Its a privately traded banking corporation, this is public knowledge and you can look it up, its not a conspiracy theory. These people literally profit off our debt and their methods of fractional reserve banking are the cause of our devalued currency.
The fact that we’ve managed to send a great deal of our middle class jobs overseas to desperate foreigners willing to work them for slave and working class wages is the leading cause of our shrinking middle class and our diminishing standard of living. A brand new, top of the line computer should not cost 1,000 dollars. The Apple III cost 3.5 thousand dollars when it came out, and that was in 1981 dollars. It was not assembled by Chinese sweatshop engineers.
For example, the Ipad 2’s labor costs are about 10 dollars. If it were built in the US with all our crazy labor laws and workers who demand fair salaries, the labor cost of an ipad 2 would be about 300 dollars. This is because Americans cannot legally be paid 1.11/hr.
Basically we as a society are either ignorant of or have no problems with our country letting private corporations print our money and hiring chinese slave laborers to build our toys. My generation is just starting to exit college and enter the work force, and we’re all in for a very rude awakening. We will not enjoy the same quality of life as our parents and grandparents, and it is not inconceivable to believe we may well even see the total collapse of our nation as a super power and maybe even as the United States of America.
However, we will continue to blame our leaders for our problems and somehow think that it makes a difference whether the president is Barack Obama or George HW Bush, because we’re a bunch of fucking idiots who allowed ourselves to be shoe-horned into a bipartisan system of government, but thats a whole different internet rant.
May 29th, 2013 at 3:03 pm -
John Barker said:
When trying to figure out how our wealth is distributed, it is also imports t to remember the distinction between the United States and similarly wealthy nations, such as Japan and UK.
We are closer in land area to the likes of Russia, China, and India (Canada, too, but they’ve got such a small population).With such geographical variety, the average/mean incomes, as well as costs of living, will vary wildly depending on your location (Wikipedia has a map from the Census Bureau that breaks it down by county). So, the average in places like rural Texas are significantly lower than, say, Maryland or New York City.
For example, I make well above the mean national income, and would live rather well in nearly any metropolis in the South, especially if I chose to commute from a more distant suburb. However, I live in Maryland, where I struggle paycheck to paycheck and make a little below mean income in my county.
People often forget these dynamics. That is why, in a billion-plus population like China, you see factories moving further inland or south to Vietnam and Bangladesh. The urban factory workers in Shenzhen and call center employees in Bangalore may be making dollars a day, but are able to afford a smart phone, car and apartment, while still sending money home.
I’m not trying to downplay the insanely widening gap between rich and poor, but When you look at it on a global scale, at least from the middle class on down, wealth is equalizing at an astounding rate increasing in developing countries while decreasing in the West.
For the first time since the start of the Industrial Revolution, the world is flattening. It is unfortunate that this happens at the expense of the West, but that does not mean there are not still opportunities. Things are more difficult for us than ever, as we now compete globally for limited jobs, food, housing, and resources, but there are still many opportunities for innovation and advancement for your career. Hell, I started washing dishes in a restaraunt, and now I have a strong career with a pension. It can be done; we just need to think outside the box.
July 15th, 2013 at 5:08 pm -
Nicolas Bollion said:
Household income can be very misleading beacause family size can change over the years and it can change differently over the years in different percentiles or quintiles. What counts is equivalized median household income.
July 22nd, 2013 at 1:39 pm -
Nicolas Bollion said:
furthermore, maybe there are more two earning families at the top than further downward in the family income distribution.
July 22nd, 2013 at 1:41 pm -
Mortimer said:
Clearly, the 93 wealthiest people have very little impact on the average income.
August 9th, 2013 at 9:00 pm -
Joseph Sexton said:
A major part of the problem is that while our generation is beginning to realize that we aren’t going to have the same quality of life as our parents and grandparents, we are still drinking the kool-aid when they tell us we need to pursue the same type of “security” they did.
Folks, a four year degree and a “pension” isn’t job security! What will it take for us to demand dramatic changes in the way we do business, government, education, etc.?
There are opportunities out there, but they are not to be found in the same places they once were. The fact of the matter is that it is easier to just float along and live in our trailers, buying whatever line of crap the latest fat-cat is feeding us.
Take charge of your own life. Find something you love, and make a freaking independent decision!September 26th, 2013 at 1:36 pm -
Groton '74, Harvard '77 said:
The media talks about this a lot.
“It probably would not be savvy in a marketing sense to tell viewers that their incomes have been stuck in the financial mud for well over a decade.”
Of course it would; it would gain interest and people would watch. The news only really talks about the bad.February 22nd, 2014 at 5:58 pm -
Don Russell said:
We’re headed for a collapse, and probably a civil war, or at least, massive criminality/rioting/looting.
April 6th, 2014 at 1:40 pm -
Tony said:
I make 17.50hr and must get every ounce of overtime offered. I have minimal bills such as; rent, van payment, food and energy. I have healthcare through my job, but I might aswell not have it. I pay 320 bucks a month for it and then have to turn around and pay a bunch more. My family has cut out entertainment expenses and we struggle to buy 100 bucks worth of food a week. We cannot save money and we live week to week. Something always pops up and we get set back and constantly pay the rent late.
My dad worked at Xerox for over 35 years and showed me a decent life growing up. When I graduated high school I followed in his footsteps and attempted to work my way up as he did. After 8 yrs I was still a temp making 12hr. So I tried a different route and the best I can do is manual labor that will most likely cause me long term injuries and shorten my life and happiness. My father turned 61 this year and was laid off from his job right before he retires.
June 24th, 2014 at 3:44 pm -
Yan said:
Where you live makes a big difference in your quality of life. We recently moved from CA Bay Area to NC Raleigh area, took a HUGH pay cut, on paper it did not make this move desirable at all financially. But guess what, with now all of the cost and bills finally shedding light on how much we really live off of, without any major life style change, we are actually enjoying a much better life here, than we had back in CA. So income is only half of the equation, expense is the other half.
August 13th, 2014 at 8:27 pm -
nate said:
wow after reading all above comments..i realise its not amount of money..its what u can buy with it…inflation etc…if i earn 50k dollars here in malaysia we are considered as rich…u can buy big houses n merc bmw cars with that amount salary….coz food petrol n rent are cheap here…
August 25th, 2014 at 3:16 am -
Joe Wilder said:
It can seem scary when you put all of these statistics together and also think about the comments pertaining to this article. It seems that you have to figure out a way or ways to generate extra income and or your own business or some type of invention in order to “beat the statistics.”
October 12th, 2014 at 1:52 pm -
Josh J said:
House and Senate members should only receive the median U.S. annual salary so that they are a more fulfilling and equal representation of The People Of The United States. Same for all Government Officials. Mayors should receive the city median income. State Reps the State Median as well as Governors. There is others as well, to many to list here. But I think this would really fix at least a couple of the problems our government has.
March 11th, 2015 at 10:58 am -
JB said:
My Dad was orphaned, then the Great Depression hit…he didn’t even have a real bed to sleep in as a kid (for him, “bed” was an old couch). Luckily, he had a high IQ and, later, the G.I. Bill, so he was able to “bootstrap” himself into the Middle Class.
One thing he told me over and over was “It’s not how much you make, it’s how much you have left.” That’s how he provided for us and for the future. So, if he didn’t have the money in hand, he simply didn’t buy it.
What did I learn from observing him: Always live within your means. I feel sorry for the younger generations who either haven’t figured that out, or are caught in a low-wage trap and simply can’t.July 9th, 2015 at 8:59 am -
Jay said:
93 households times 79,000,000 divided by 340,000,000 Americans equals an increase of the average by $21…
September 5th, 2015 at 11:23 am -
tommy t said:
unions unions unions unions. Unions provided job protection, benefits and retirements. components for a successful life, career, marriage. Less unions Less prosperity CEOs making 300 times more earnings than their workers.
October 13th, 2015 at 8:19 am -
tommy t said:
we are now global. we have now local and global wage earners in the U S. global wages are in general smaller.
October 13th, 2015 at 8:26 am -
Anti-US said:
do not worry americans. Soon enough Putin will come and set you free.
December 8th, 2015 at 5:33 am -
vishal said:
So people (John Barker) are saying that call centre workers in Bangalore are earning a hefty income -buying car and apartment, might be true, I wonder which company the are refering to? Well I live in Bangalore and two of my cousins and three of my friends are working in call centre too, their shift 9am to 6pm each of them earning around 15,000-20,000 rupees per month roughly on today’s date(14 Dec 2015). They dont care about it much as they are in their late 10s or early 20s. They are still dependent on their parents though. The cold truth will hit them and lakhs like them at some point that their income is not sufficient to even support a family of three.Let alone the thought of starting a family. Lets do the calculation- avg of 20000 rupees per month while working 9hrs a day is equal to earning 75 rupees an hour max. Now the exchange is 65 rupees=1 american dollar. The extremely lowest paid people of America (a waiter or a sweeper) are earning 5dollars an hour. Which is 325 rupees an hour.
Let me introduce you to some facts:
-the call centre workers cant afford an apartment.
-my friends are living in 4m*5m rent room shared by 5 people.
-while getting a call centre job in here is like winning a jackpot, many people cant even get it as they cant speak English.
-life here is very tough my friends.
-guess how much a construction worker, labourer, sweeper earns a day-just 150 rupees or 2$ after a whole day of tiring work.
-petrol costs 1.3$ per litre.
-engineers get starting salary package of 10,000rupees per month or 40 rupees per hour or 0.6$ per hour.
-I am an engineering student 3rd year in india
-and I would be delighted If I start earning more than 4$ per hour after ten years…a hope to start a family.December 14th, 2015 at 10:37 am -
Otis Houston Jr said:
Got a check in my pocket flowers flowers flowers in my hand got a check in my pocket and I’m a happy Man Got a woman who love me and treat me right got a woman who love me and give it to me like I like Got love in my heart and I love working hard got love in my heart and I know Jehová God Got me a good job a lots of people don’t got me a good job and I don’t have to want Got a check in my pocket and flowers flowers flowers in my hand got a check in my pocket and I’m a happy Man
Black Cherokee
January 8th, 2016 at 10:45 am