Southern California Half Off Sale: 11 Los Angeles County Zip Codes with 50% Year over Year Price Drops.
- 5 Comment
What once seemed like a total impossibility has occurred in Los Angeles County and in many other cities throughout Southern California. During the decade long housing boom, you would be thought mad if you would guess that any zip code in Los Angeles County would fall 50% in any given year. In fact, during many of the years each and every zip code was appreciating in the double digits. It was an unprecedented boom that took no prejudice on any city or area in the county.
It was rather apparent that what was going on simply was unsustainable. At the yearly change rates housing prices in the county would have a $1 million price tag sometime in the next few years while incomes simply were not keeping up. Real estate prices need to reflect the ability of local buyers, otherwise it is mere speculation in the short run. That is what occurred. City after city, even those where people never intended to live rose up for the mere prospect of speculation. In some areas, home owners were defrauded with unscrupulous loans that we are now seeing come home to roost. This was beyond one or two bad loan officers. This was fueled by complicit organizations from the top down that wanted to funnel as many loans to as many people irrespective of their ability to pay the money back. It was also fueled by buyers looking for a quick buck. The setting proved explosive. Los Angeles County is the ultimate result of years of this behavior.
Now we are left with a mess. The impossible has occurred. Here is a look at 11 zip codes recently released that now show Los Angeles County does in fact have the capability of going negative by 50% in one year on their median single family home price:
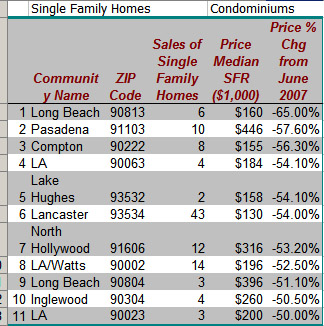
When you look at the list and if you are from the area, these are many lower-income neighborhoods. What this tells us is many of these areas had the thinnest margin of error and borrowers were put into the most dangerous of loan products. After all, just multiply the current median price and you quickly can understand how absurd prices got. The majority of these areas have household median incomes that are less than $50,000. Yet in some of these cities, prices ranged from $500,000 to above $800,000! In no way shape or form was this even sustainable. What is occurring is many of these areas are now being devastated unlike anything we have seen in the county. Never have prices fallen so quickly and with such speed.
If we are also to include, those areas that fell by 40%, our list grows to 29 zip codes:
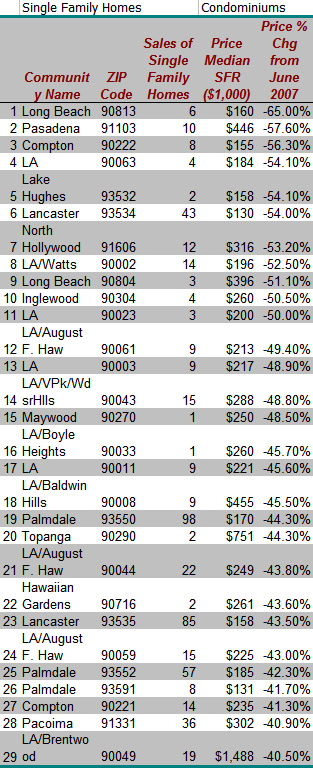
Again, what you’ll notice for the most part, the vast majority of the hardest hit areas are those in lower income areas. It is one thing to say that all areas are being impacted. But once you see the magnitude of the housing crash, it becomes rather apparent which areas are taking the absolute brunt of the major damage.
In Los Angeles County there are 88 cities with 270 zip codes. Some cities like Long Beach and Los Angeles have a multitude of zip codes because they are extremely large. If on our list we were to include all the zip codes that are down by 30%, our zip code list increases to 76. 20% and more? 133 zip codes.
Out of 270 zip codes only 30 zip codes showed positive gains and some of these areas are Malibu, Pasadena, Santa Monica, Calabasas, Beverly Hills, and Hermosa Beach. Do you notice a certain pattern here?
What is apparent from the list is that the overall pain in the county is vast and widespread. The overall county is now down by 30% on a year over year basis. The middle class areas are now starting to face a strong punch like the zip codes on the top of the list. The question is, how deep will this correction go? Obviously the zip codes that are still positive on a year over year basis are the last to feel the real pain of the credit collapse. Only time will tell. The futures market is pricing in a bottom for Los Angeles County in fall of 2010. Given that there are many loan recasts waiting to happen, this is a good estimate but the pain will linger far beyond that date.
If you enjoyed this post click here to subscribe to a complete feed and stay up to date with today’s challenging market! If you enjoyed this post click here to subscribe to a complete feed and stay up to date with today’s challenging market!
5 Comments on this post
Trackbacks
-
Dumb said:
This is insane. Only a fool would buy a house out of their budget. All these people are fools. They and the banks deserve what they get. The tragedy is not the fools that lost the houses that they “purchased”. The tragedy is the people that saved and chose not to buy may have to bail these idiots out.
July 22nd, 2008 at 1:13 am -
notjonathon said:
If you drive through the western part of Los Angeles on a weekend, you will find several open houses in every neighborhood, including Beverly Hills and Bel Air. Drive up Beverly Canyon and it seems that every other home is for sale. Continue out Sunset and you will be overwhelmed by the sheer number of for sale signs. The crunch is coming to the canyon, and pretty soon you will see them walking.
July 22nd, 2008 at 5:03 am -
Wow said:
Incredible. But not surprising. What is the data source for this?
Could be something to follow over the next few months.July 22nd, 2008 at 8:13 am -
Funky Uncle said:
Looks like DataQuick’s LA Times chart…
http://dqnews.com/Charts/Monthly-Charts/LA-Times-Charts/ZIPLAT.aspxJuly 22nd, 2008 at 12:23 pm -
Ian said:
I think what’s even more striking are the number of sales, or lack thereof. That speaks volumes to the financing situation today.
July 22nd, 2008 at 4:00 pm