Stock Market Volatility is Back: Approaching a Decade of Lost Returns on Investments. The S&P 500 can fall another 42%.
- 1 Comment
The stock market is off to a horrible start for 2009. Many thought that things could not get worse than what we experienced in 2008. Yet market volatility, a sign of an unhealthy economy, is still with us and appearing again in a ferocious way. From January 4, 2008 to February 21, 2008 the S&P 500 was off by -9.2%. The S&P 500 during that same time for 2009 is now off by -14.75%. The issues we will now face are a continuing stream of declining earnings because of the pullback in consumption and the tightening up of the credit markets. It also doesn’t help that consumers are psychologically more cautious because of what is going on.
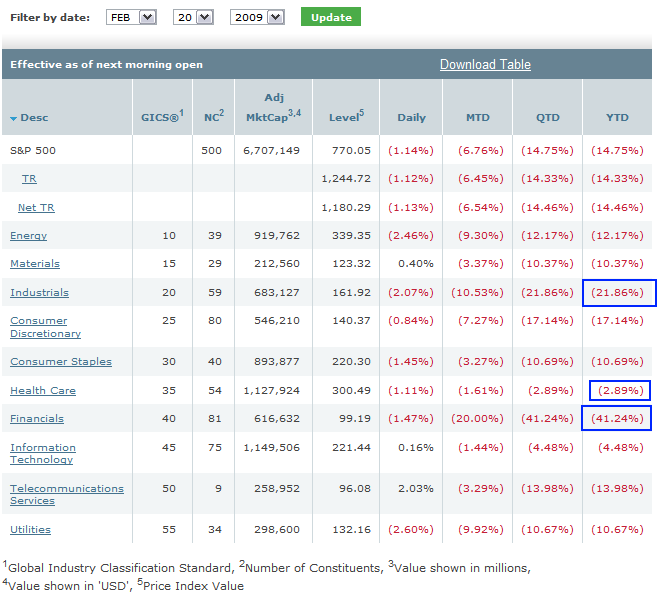
The S&P 500 hit a peak in October of 2007 at slightly over 1,560. At the peak, the S&P 500 had an adjusted market cap of $13.754 trillion. The current value of the S&P 500 is $6.7 trillion and the losses are across all industries:
The only sector that is not seeing double-digit losses is healthcare but even that, it is still down for the year. Of course, much of the downfall has occurred because of the pounding financials keep taking. The current level for financials is an adjusted 99.19. What was the level of financials back in the October 2007 peak? Try 475.86. What that means is the financial portion of the S & P 500 has fallen 79% in less than 2 years. Many other areas are also facing pain in the mean time. You don’t lose $7 trillion in market cap and expect other sectors to be fine.
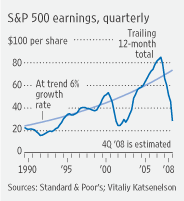
Earnings for the S&P 500 have fallen off a cliff and are going to face their first quarterly loss since the Great Depression:
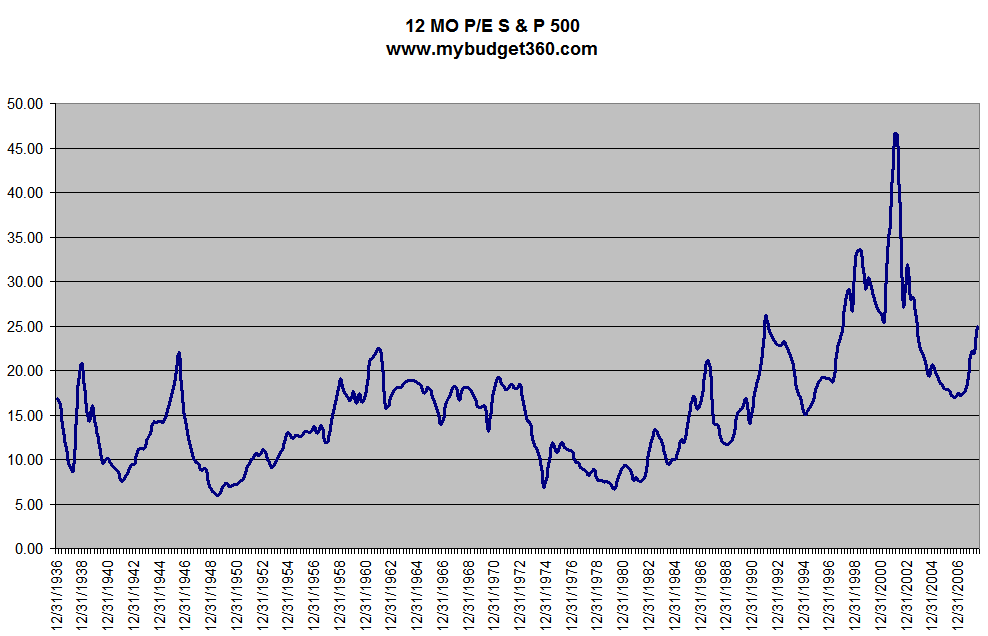
Consequently, the P/E ratio has increased in the past 2 quarters although I expect this to go down. Why has this occurred? Easy, prices have collapsed in line with earnings:
You need to remember how this ratio works. If earnings are increasing at the bottom and prices drop or stay steady, the P/E will have a smaller nominal value. This is good. It means the price of the stock is cheaper. But what is occurring even though the S & P 500 is off 50.6% from its peak value is that earnings have been tanking as well. So that is why in 2008 you see the P/E move up. This is somewhat counterintuitive but happens in most recessions. Take a look at the 2001 recession and the bubble peak. The P/E shot up to over 45 before bottoming out at 19.29 in 2004.
If we are to believe this is one of the worst and deepest recessions since World War II, we can expect prices to continue to fall. Now let us go back to the P/E chart above. During the 1940s the S&P 500 dropped to a P/E of 5.9 in 1949. We are nowhere remotely close to that and until we see the P/E at 10 or so, then we can assume a bottom (that is unless earnings start exploding to the upside which is not going to happen).
I ran a quick analysis and the average quarter earnings since 1940 is 15.79. We are still above that. So there is much more correcting to do.
Some are arguing that the fair value of the S&P 500 should be somewhere around 440 if we take a multiple of 15 which would be in line with historical P/E ratios. That is a stunning number but makes sense. That means the S&P would need to fall an additional 330 points, a drop of 42% from where we are currently at. That is hard to imagine yet the math points us in that direction.
If you enjoyed this post click here to subscribe to a complete feed and stay up to date with today’s challenging market!1 Comments on this post
Trackbacks
-
Mustafizur Rahman said:
I am a smallest investor and always losing money.Please advice
me where a park my tiny money now.April 5th, 2009 at 7:20 am


 If you enjoyed this post click here to subscribe to a complete feed and stay up to date with today’s challenging market!