Who controls the wealth in the US? Western countries expand balance sheets at the expense of their younger population.
- 3 Comment
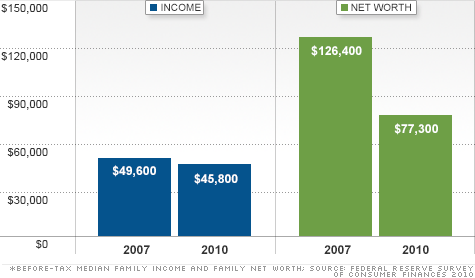
If the debates reflected the true interest of what Americans have on their mind the entire debate would revolve around the slow erosion of the US middle class. Yet this is something that will only be a footnote and for any discussions that do come up the specifics will be lacking. The reality is we do have a middle class crisis in the US. Americans are being fleeced through inflation on daily goods and we have an incredible 46+ million Americans on food stamps, a record percentage of our population. Yet the stock market slowly inches up to a near record high. How is it then that most Americans because of this recession lost 30 to 40 percent of their wealth? Part of this has to do with how wealth in the US is structured. The reality is we are making it tougher for mobility to occur thanks to the massive higher education bubble.
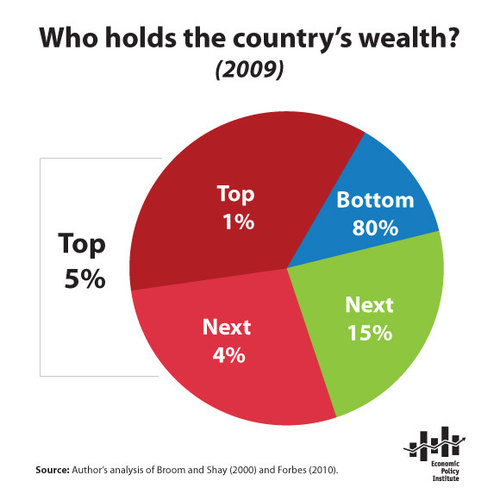
Who controls wealth in the US?
When you really boil it down wealth is the best measure of economic wellbeing. Saying that the per capita income is $25,000 or the median household income is $50,000 only takes you so far. Most Americans barely have enough to get by. One out of three Americans has no savings to their name and those that do, typically have a massive portion locked up in home equity, a major reason why the net worth figures took such a big hit. But first, let us see how wealth is structured in the US:
The top 5 percent control nearly 64 percent of all the wealth in this country. What is even more important to highlight is that most of the financial wealth (i.e., stocks, bonds, etc) are held by this small group. This is a primary reason why the stock market jumping up over 100 percent from the low in March of 2009 has largely done very little to help the bottom line of most Americans. Many companies also increased gains by overseas expansion and also cost cutting via layoffs/wage reductions.
The Federal Reserve has been instrumental in ensuring success for this group but at the expense of many Americans. For example, the policies of QE3 are forcing rents to increase dramatically:
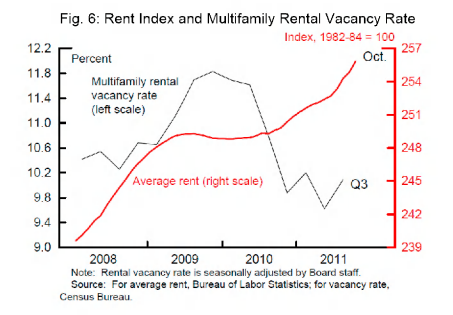
Many lower income and working class families are unable to own so creating a market where rents are forced up largely pushes up their financial burden. You are also seeing major inflation in food costs which is a direct hit to those 46 million Americans on food stamps. Everything comes at a cost and the current trajectory is largely a drag on working and middle class families. The figures are as clear as day:
This recession has done a number on the middle class. However what we are also seeing are some deep structural changes to our demographics. We have a large and older population with baby boomers entering retirement age. We have a smaller less affluent younger generation that will need to support this generation. Yet we are seeing major changes in household formation:
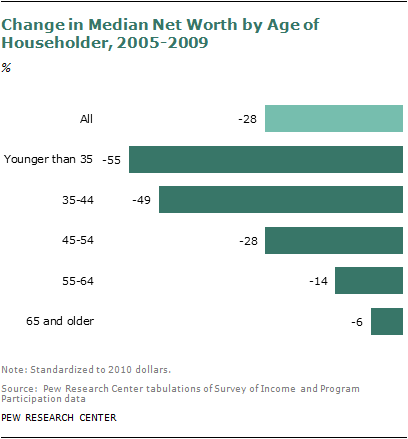
What busted the trend? You have a record number of 25 to 34 year olds moving back home with parents and you also have the delay of household formation. Expensive housing costs and also a giant burden of student debt is a reason to blame for this. It is also good to highlight that younger Americans took on the deepest hit from this recession:
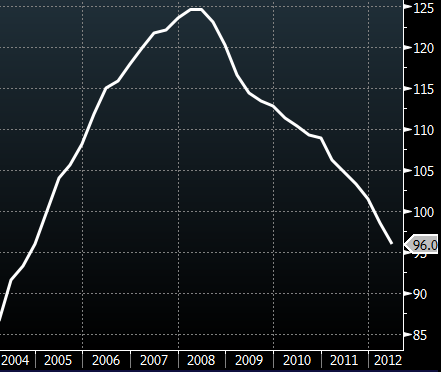
Boom and bust cycles are largely a part of the global game. Other countries that are facing challenges with their youth are places like Spain for example. Spain is also feeling the brunt of a bursting housing bubble:
Spain housing market index; 2005=100 (Bloomberg)
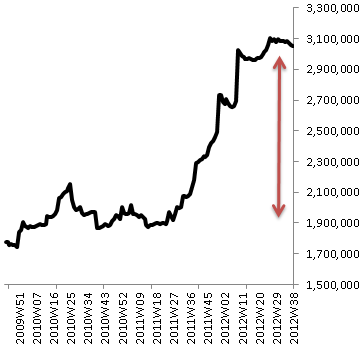
Of course the European Central Bank like the Fed has been laser focused on protecting their small wealthy class while the youth unemployment rate is up to 50 percent:
ECB balance sheet (€mm)
Welcome to the new world economy. Of course little of this will be mentioned over the next month leading up to the election.
If you enjoyed this post click here to subscribe to a complete feed and stay up to date with today’s challenging market!3 Comments on this post
Trackbacks
-
clarence swinney said:
I wanted blood in debate got smiles
OBAMA BLEW IT
He could have destroyed Romney with facts and attacks on predecessor
I have E-mailed data to the White House many times. Ignored?SPENDING–BIG GOVERNMENT
Bush last budget spent $3510B.
Obama last budget(2013) projects $3800B
That is 8.6% increase in spending or lowest in historyDEFICIT—Bush last budget ended 9-30-09 with a $1400B Deficit
Obama last budget(2013) ends 9-30-13 projects $901B deficit.
A 35% cut (he promised 50%)TAXES—Bush gave biggest tax cut in history. We borrowed $6100 B much of which
was because the rich kept their money and were not taxed enough. Romney promises more of Bush tax cuts which cuts revenue and increases debt.
Obama cut taxes for 96% of workers to stimulate the Great Recession economy. His Executive order Efficient Spending in Government was designed to offset some of the lost revenue from the payroll tax cut.
Today, We rank just below Mexico and Chile As Least Taxed nation.
Obama 2013 budget projects tax revenue of $2900B or 20% of our national income and 21% of our gdp. Our National Tax Rate is 20%. It “Must†go up to pay off debt.Obama should have attacked his predecessor but he will never do it en mass.
Let Obama ratings fall watch out. He may get mean which is not his nature.He inherited a hell on earth why not use it.?clarence swinney
October 4th, 2012 at 11:36 am -
Abraham H. Horstin said:
Excellentb article, thank you.
October 5th, 2012 at 4:57 pm -
clarence swinney said:
PAST 50 YEARS OF GOVERNMENT TO 2010
——————————-R——-D
Years in Presidency——28—–22
Total jobs created——–24m—42m
stock market return—–109%–992%
return per annum——–2.7%—11%
gdp growth per annum–2.7%—4.1%
Income Growth annum-0.6%—–2.2%
Sources-
Dept of Labor
BloombergOctober 9th, 2012 at 4:27 am

 If you enjoyed this post click here to subscribe to a complete feed and stay up to date with today’s challenging market!