The banking protection racket – 5 charts highlighting the laundering and dismantling of the middle class. New methods of looking at employment. Peak debt and tweaking statistics.
- 2 Comment
Part of the crushing blow to the middle class is the misinformation being lobbed out as good economic news. For example, inflation is increasing yet the average American worker pulls in $25,000 per year. You also have the civilian population ratio still at levels last seen three decades ago. It depends on how you look at the data and how much spin you can tolerate. Should we be jumping up and down for joy that many Americans are now getting low paying jobs with absolutely no long-term security? As we analyzed in a previous article, in the early 1980s some 60 percent of American workers had some sort of pension. Even if it was minimal, it was something. Today it is down to 20 percent and quickly evaporating lower. Since we have become a debt addicted nation, the fact that household debt has contracted many Americans are now actually “poorer†and definitely feel it. Consumption makes up a large portion of GDP so this is a potential problem with households facing a major contraction.
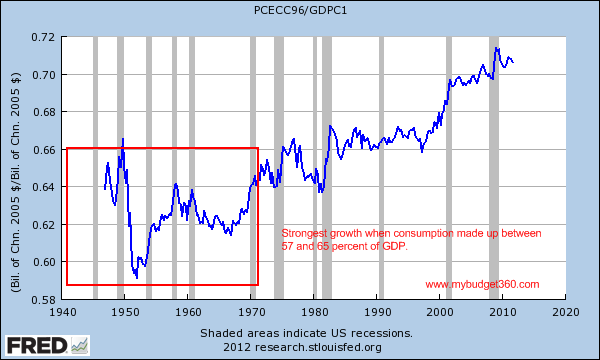
What is the ideal rate of consumption?
Economists always wrestle with the ideal amount of consumption for a society. Our goldilocks range seems to sit between 57 and 65 percent:
Some of the best growth years for middle class families came in the 1950s and 1960s. More people attended college without going into debilitating debt, jobs were plenty, and actual salaries were growing. The cost of items like housing was in line with incomes so people didn’t have to go massively into debt to finance their purchases. Yet that colossally changed and it looks like in the late 1990s is when we went into a consumption binge purely on debt. This brings us to the next chart of household debt.
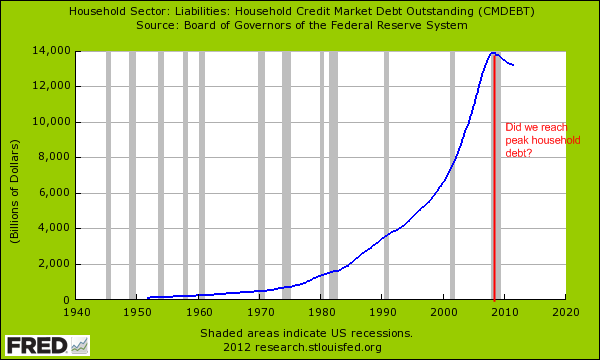
Did we reach peak household debt?
With incomes stagnant or falling, many people decided to finance their consumption with large amounts of debt:
How was this even possible? The big banks largely flooded the market with debt for cars, homes, and even higher education. Debt was the avenue to all of life’s biggest purchases. As you can see from the chart above household debt has gone only in one direction until this recent bubble burst. So while government debt continues to grow and the Federal Reserve continues to bailout the banking industry, household debt has contracted. You pay your debt from actual work and this is where the pain is being felt.
Employment ratio for the American economy
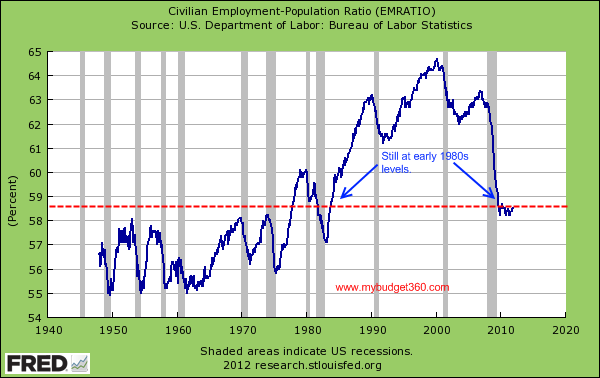
A better measure of employment is the civilian employment-population ratio.   What this measures is the proportion of our country’s working-age population (those from 15 to 64) that is employed. And from the chart below you realize why the working and middle class don’t buy into the recovery talk:
Where is the recovery? It doesn’t appear. Sure you can play around with numbers and juice the data but the above speaks rather clearly. And if we look at actual job openings we begin to see an even clearer picture.
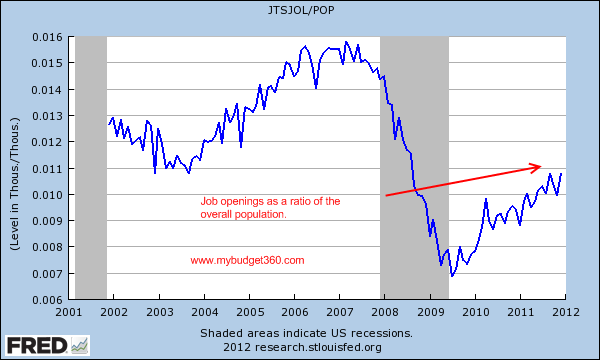
Job openings to population ratio
Another way to look at this is to use a ratio of the US population and divide it out with the number of job openings:
Unfortunately the data on job openings only goes back to 2000 but you can see why this doesn’t feel like any recovery at all for most Americans. The number of jobs open is not that impressive when you measure it out to our population. Contrary to other metrics, the cost of living is going up and that brings us to our final chart.
The hidden cost of bailouts and Fed policy
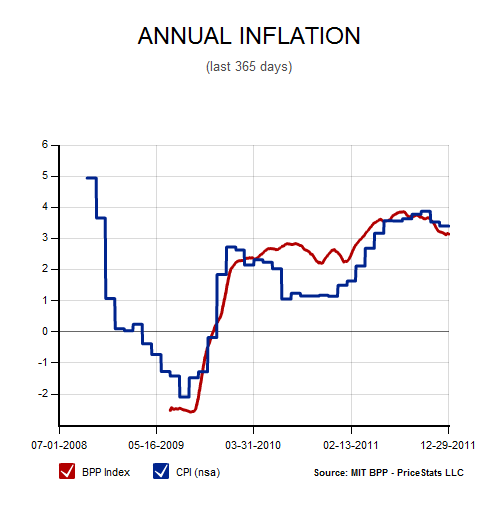
Household wages have not benefitted from the trillions of dollars in bailouts. Banks of course are back to their gambling ways even after bringing the economy to a near depression. The end result? Nothing has changed.  Even with credit being tighter people are opting for instant payday loans.  But inflation is creeping into the market:
Inflation is now running at a near 3 percent clip but wages are stagnant or falling. So in the end Americans are becoming poorer to finance the bailouts for the banks. Just look at the cost of fuel, food, healthcare, and education and you’ll see where items are rising.
As all these items collide we have a pattern that looks like this:
-Continued bailouts to the financial sector (the perfect synergy between Wall Street and government)
-Bailouts come from Federal Reserve and the cost is shifted out to the public via higher inflation
-We are entering a low-wage capitalism era
-The middle class is being crushed. The top one percent control more wealth than they did to the years prior to the Great Depression
This is the not the path to prosperity here. When we finance gamblers and protect those that siphon off from the productive sectors of the economy we are destined for a repeat of the crisis.
  Â
If you enjoyed this post click here to subscribe to a complete feed and stay up to date with today’s challenging market!2 Comments on this post
Trackbacks
-
Robert said:
Excellent piece. As outrageous as financing gamblers(“This is the not the path to prosperity here. When we finance gamblers and protect those that siphon off from the productive sectors…”) is allowing them to make enormous political contributions.
February 10th, 2012 at 11:02 am -
JB said:
It all boils down to economic inequality vs. shared responsibility and prosperity. When you have a system where a presidential candidate can give $100 million to his kids tax-free (the IRS said that it wasn’t income) or plunk millions into a Roth IRA when working stiffs were limited to $5,000 or so annually, call for the elimination of capital gains and estate taxes, stick millions of bucks offshore in the Cayman Islands and Swiss banks, pay less than 15% in federal taxes, and then rail about talk of “economic inequality” being “class warfare”, we have a problem. Paying your fair share in taxes isn’t just “wealth redistribution” — look at the highest tax brackets post-WWII: 90%+…we all had to pay our fair share of the cost of the war.
Look at the “off-shoring” and “out-sourcing” of livable-wage American jobs, replaced by $10/hr. service-sector jobs like home health aide, personal care worker, fast-food employee, and a host of part-time, benefit-less, so-called occupations provided by the fat-cat “job creators”… We have a problem.
And look at the cost to the taxpayers for the bailout of Wall St. and the big banks — the greedy crooks who engineered the near-collapse of our economy kept their millions, leaving the rest of us holding the bag. And the millions of home-buyers suckered into “sub-prime” mortgages they couldn’t sustain — just look at what that did to the equity of those already owning their homes. We have a problem.
And consider what ‘Citizens United’ did to the political voice of the Average American — Will Rogers said that “An honest politician is one who stays bought”… We have a problem.
To the Big Banks, Mega-Corporations and their over-paid CEOs, the self-described “job creators”, bought-and-paid-for judges and politicians, Wall St. “One-Percenters”, and all the rest of their ilk, I say “KYFHO” (keep your effing hands off)! Hey, the rest of us buy the products that keep the economy going and keep the politicians in office, so how’s about a fair amount of shared responsibility and prosperity for a change?July 9th, 2015 at 9:56 am
 If you enjoyed this post click here to subscribe to a complete feed and stay up to date with today’s challenging market!