Submarine housing markets – Negative equity map and the 7 metro areas where mortgage balances outweigh the entire stock of housing. Examining underwater housing across the U.S.
- 1 Comment
Negative equity at such a large scale is a rather unique phenomenon from this housing bubble. Even just a decade ago, a person got into a negative equity position due to a really significant shift in a localized market. For example, a city lost a major manufacturing company that supported most jobs and home values subsequently collapsed. You can think of places like Detroit that were already facing falling home values even before the bubble hit. The trump card however was always the down payment. It was extremely rare for any market niche to fall by 20 percent all of a sudden. So at the very least, there was a buffer to support a needed quick home sale. Another important aspect of the housing market before was that home prices were cheaper so people actually built up more equity quickly and the vast majority of loans paid principal in each payment. Yet the market radically shifted from the late 1990s to 2007 and one of the most pervasive problems we face today is that of negative equity.
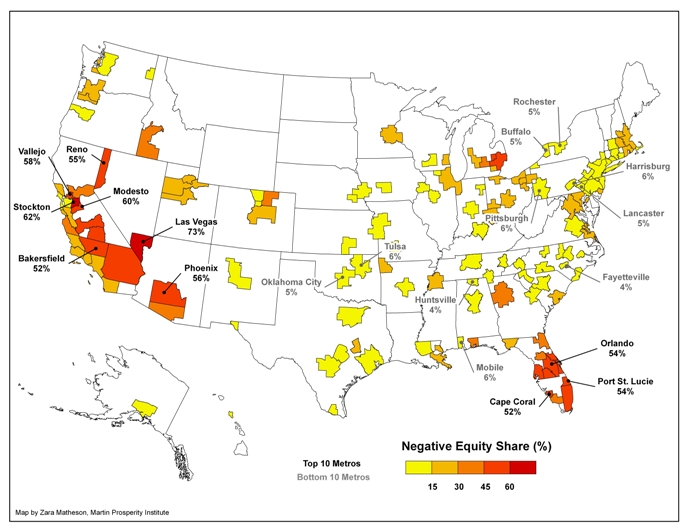
Yet negative equity, the position of owing more on your home than it is worth, is really a market specific problem. Take a look at this map that pinpoints negative equity metro areas around the country:
Source:Â The Atlantic
“The first map above, prepared by Zara Matheson of the Martin Prosperity Institute based on data from Core Logic, shows the percentages of mortgages that are underwater across U.S. metros. Las Vegas tops the list with nearly three-quarters of all mortgages underwater. More than half of all mortgages are underwater in Stockton, Modesto, Vallejo-Fairfield, Bakersfield, and Riverside, California; Port St. Lucie, Orlando, Cape Coral, and Fort Lauderdale, Florida; Phoenix, and Reno. In Miami, Tampa, and Detroit, more than 45 percent of all mortgages are underwater.â€
The above map clearly shows where the real negative equity is. The entire state of California and Florida is virtually in a deep negative equity position. Is this only a big state problem? Actually it isn’t. If we take a look at Texas some of the worst negative equity regions there have 5 to 15 percent negative equity. This isn’t to say that they were completely immune but clearly being a big state doesn’t mean you’ll be underwater. One thing Texas had was stricter regulations on home equity loans that kept people from using their homes like piggybanks and depleting their already built home equity.
The worst market in terms of negative equity is Las Vegas. Nearly 73 percent of all loans are underwater! This is simply incredible. Much of the Las Vegas bubble was built from home equity from places like California. That is why the market has taken a bigger hit than California. I wanted to break down the actual data from the above article even further. There are 7 statistical areas from the CoreLogic report that actually have a negative balance for the entire market. These are the negative equity epicenters:
Source:Â CoreLogic
It is rather straightforward to examine. For example, the total property value of mortgaged Las Vegas property is $73 billion. At the same time, there are $96 billion in loans outstanding on these locations. These areas are highly concentrated in California, Nevada, and Florida. Phoenix didn’t show up because it is basically a no equity zone. In other words, the stock of real estate with mortgages has no equity on aggregate. This isn’t to say that many homes in the area are underwater because they are. Even the map above shows you that 56% of mortgaged homes in Phoenix are underwater. Yet you have other homes with enough equity that bring the market to a breakeven point. However you slice it, this is horrible news for these markets.
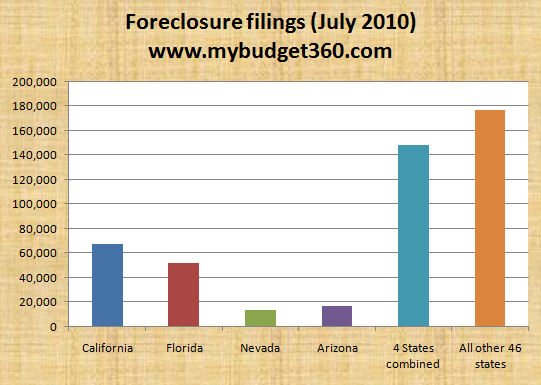
Negative equity is the aphrodisiac to strategic defaults and more foreclosures. Given the above data and the research on negative equity, we can expect foreclosures to be dominated by these markets.
So it isn’t a surprise when we see the last month of foreclosure filings looking like this:
Expect the trend to continue with the large amounts of negative equity.
If you enjoyed this post click here to subscribe to a complete feed and stay up to date with today’s challenging market!1 Comments on this post
Trackbacks
-
Harrold Waggoner said:
IMHO, there are 3 major credit bubbles in the US. One is student debt, the second is mortgage debt (yet again), and the third is auto loans. During the last depression, auto loans were fairly safe. They were only made for 3 to 5 years, and usually for half the value of the vehicle (or less). Today, 10 or 15 year vehicle loans are common, and these are not for commercial vehicles, but private passenger autos. In addition, the borrowers are 3rd and 4th tier borrowers. Most of these ppl have their credit cards “maxed out”, and very large home loans to boot. If one of them loses their job – they both are bankrupt. As the economy worsens [and it still is], i suspect that we’re gonna reach a point where the ‘perfect storm’ occurs, and we are hit with a large number of defaults in all three of these areas. That will herald the real onset of this depression. Cheers.
May 30th, 2016 at 12:17 pm


 If you enjoyed this post click here to subscribe to a complete feed and stay up to date with today’s challenging market!