The Miseducation of the California Housing Market: 3 Reasons Why California Housing Still Has 3 Years Before Hitting a Bottom.
- 16 Comment
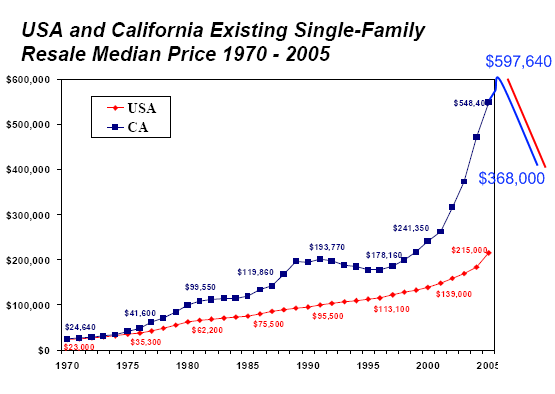
California housing has been an enigma for most in terms of pricing. How in the world did the median price for a California home reach $597,640 at the peak of the housing bubble? That is a question that historians, economist, and writers will need to answer once the ashes are left. But we are still in the burning flame.
California wasn’t always an expensive state. If you ask most people they will tell you, “California housing has always been expensive!” but this in fact is not true. In fact, we only need to go back to 1970 to see the last time that the median US home price was equivalent to that of California:
So what happened to send prices so high? Obviously the population of California has been exploding since that time:
California Population 1970: 19,953,134
California Population 2008: 36,457,549
So the growth in population certainly had something to do with it. In addition, prime locations, the weather, the legend, and glamour all played into the idea of prime real estate. Yet the mistake that is made in each bubble we have here in the state is that of contagion. That is, assuming every ancillary area is going to do well simply because it is close to Santa Monica, Newport Beach, or La Jolla. This seems to be a mistake always made.
If you look at the chart again, you’ll also see the late 1980s early 1990s bubble which also burst. However, that bust came because of a recession followed by falling prices. This is the inverse. Bursting housing prices have led to this economic calamity and this thing is nationwide.
The C.A.R. also has a data set for California:
Prices simply went into unsupportable levels. We have a 17%, 20%, and 16% yearly increases on a consecutive basis which sent prices from $372,700 to $524,000 in 3 years. There is no way that is sustainable especially when incomes did not follow.
Let me give you 3 major reasons why California will not see a bottom until 2011.
Reason #1 – Employment
First of all, the California unemployment rate is one of the highest in the country. The last time we had a 7.7% unemployment rate was in March of 1996. California is already in a deep recession. The fact that the Governor is going to call a special session later in the week is troubling. Why are they calling a special session especially when they just finished hashing out a budget? Well revenues have fallen off the deep end and we now have a $10 billion short fall…again.
The reason employment is so important is because any talk of buying a home is muted if people don’t feel secure in their jobs. The fact that California had so many people dependent on the housing industry is troubling. Jobs in:
Construction
Real Estate Agents
Brokers
Finance
Insurance
Furniture
Household Electronics (i.e., Best Buy and Circuit City)
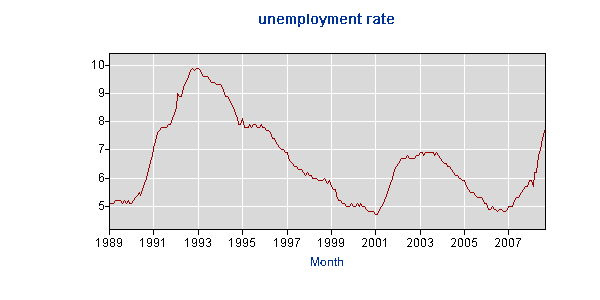
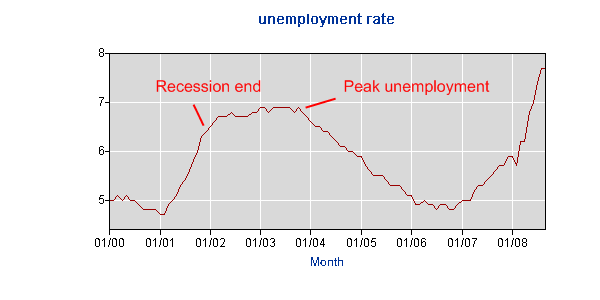
Once the high paying real estate industry jobs are gone, they are not coming back and certainly not at levels seen at the peak. Now why is this problematic? Well first, we are still technically in no recession. But even once a recession is over, peak unemployment isn’t reached for about 2 years. Take a look at nationwide unemployment and our last recession:
So assuming that the 4th quarter GDP is negative which all signs point to this, the recession will have officially started in July of 2008. Meaning, peak unemployment will not hit until the middle to late 2010 assuming the recession is done quickly (which I doubt). Now given that California is more reliant on housing, how long will it take us to bottom out?
Given the above chart, California employment tracked the nation numbers seeing a peak reached until the end of 2003. This time, we probably should expect this to last longer in the state for a couple of reasons. We had a bigger housing bubble, more problems with our state budget, and heavy reliance on the real estate industry.
Reason #2 – Inventory
There is an insane amount of homes on the market for sale in California. According to DataQuick, 40,317 homes sold in September of 2008. Of the homes that sold in September a stunning 51.1% were foreclosure resales. Basically California is trying to sell as much as it can as quickly as distress sales are coming in.
In addition, the data released by DataQuick shows the median price for a California home at $283,000. They calculate their numbers different from the C.A.R. and DataQuick had their peak at $505,000 for the state. Either way, we are quickly approaching a 50% half off sale.
So given this amount of sales, how much inventory does California currently have? That is the real challenge. I went through ZipRealty and gathered the current data for each major metro area in California:
Greater L.A. and San Diego:Â Â Â Â Â Â Â Â Â Â Â Â Â 127,064
Central Valley South:Â Â Â Â Â Â Â Â Â Â Â Â Â Â Â Â Â Â Â Â Â Â Â Â 15,321
San Francisco Bay Area:Â Â Â Â Â Â Â Â Â Â Â Â Â Â Â Â Â Â Â Â 37,098
Sacramento, Central Valley North:Â Â Â Â 24,420
Eureka Area:Â Â Â Â Â Â Â Â Â Â Â Â Â Â Â Â Â Â Â Â Â Â Â Â Â Â Â Â Â Â Â Â Â Â Â Â Â Â 200
Total Estimated Homes for Sale:Â Â Â Â Â Â Â 204,103
*Data as of November 4th
Keep in mind this doesn’t cover all areas but the largest areas, so it does give us a representative sample. Keep in mind, this data doesn’t include a large number of REOs and many lenders are now modifying loans so these are in limbo since many will become REOs. How many REOs are on the market?
September 2008
Notice of Defaults:Â Â Â Â 21,665
Trustee Sales:Â Â Â Â Â Â Â Â Â Â Â Â Â 20,510
REO:Â Â Â Â Â Â Â Â Â Â Â Â Â Â Â Â Â Â Â Â Â Â Â Â Â Â 27,373
Given that nearly 90+% of Notice of Defaults are going into foreclosure, the peak sale month is essentially just keeping up with the distress sales hitting the market. That is why over 50 percent of sales last month were foreclosure resales. Even if we ignore the distress sales, which is hard to do but try for a second, there is 5 months of inventory on the market. Eliminating the distress sales, we are over 10 months of inventory on the market. Until we hit a 5 month inventory level without distress sales, then we can safely assume there is a bottom approaching.
How can you even begin thinking there is a bottom when we are entering the slow selling season and the number of sales is less than the number of distress properties coming onto the market?
Reason #3 – Credit
We keep hearing about the credit crisis now getting better since banks are flooded with money. Oh really? You wouldn’t know that by looking at mortgage rates. Take a look at the rate sheet for Wells Fargo:

Take a look at those jumbo rates!  Over 10%! And you wonder why the high end market in California is simply sitting idle while cheap foreclosures falling under the $417,000 conforming loan limit are selling.  And even the current rate is still high given that the Federal Reserve is back to a 1 percent rate and the U.S. Treasury has essentially given banks loads of capital.  All they are doing is hoarding the money since they sure aren’t lowering rates.  Remember back in the day when Alan Greenspan flooded the market with easy credit and all was good?  Some 30 year fixed rates hit 3.75%! We are nowhere near that.
The Fed this time is back to 1% yet mortgage rates aren’t responding.  Why? Because they are actually operating in reality now. They are now checking income and guess what?  Folks don’t have the cash. Even with modest 10% down payments the market has come to a screeching halt.  Think about it. The median household income in California is slightly over $60,000 yet the median price is $285,000.  They would need $28,500 saved up to purchase a home. Given that after taxes a family making $60,000 a year is pulling in $3,500 to $4,000 tops a month, they would need to save $2,375 a month for one year or $1,187 for two years.  Given this economy do you think people have that disposable income?
Even if folks start today (good luck with our negative savings rate) they would have enough in maybe 3 years. At that rate they would need to save $797 a month to have the downpayment.  That is more doable. This is how people bought homes in the past.  We are going to have to learn to do it that way once again. At the earliest, we won’t see a bottom until 2011.
If you enjoyed this post click here to subscribe to a complete feed and stay up to date with today’s challenging market!16 Comments on this post
Trackbacks
-
Harry Tran said:
Very well written. Being that I was born and raised in San Francisco the price of homes in SF were never attainable by the average individual. You had to give in to a lifetime of servitude in order to even attempt to own property in San Francisco.
I am definitely rooting for the bubble to collapse for a while, although unlike a natural bubble collapse this doesn’t fair as well, cause its so tied to how much we save and spend. And the economy is rolling itself over in its grave now.
November 4th, 2008 at 10:52 pm -
Qatar Boy said:
I’d agree with most of the stuff stated above, yet, I am curious what’s gonna happen with th upper end of the market as it has shown quite bit of immunity to the crisis. Cheers, Amar
November 4th, 2008 at 11:02 pm -
William said:
Thanks for the informative article! I’ve been watching home prices and you hit it on the nail with 2011 being the earliest, i personally think it’ll take till 2014 or so and stay flat there for a few years. There’s a site that I’ve been using to track and the prices in California seems to be going down weekly!
November 5th, 2008 at 1:45 am -
Jackson said:
All I can say growing up in California is that none of that real estate plagued with fires, earthquakes, unrest, and pollution is worth anything near what it is at today. This was simple unchecked greed that has come back to haunt them. Santa Monica where I grew up is grossly overrated. It is dirty, crowed, and now polluted. I will not touch the reality of that one horse pit stop called Malibu. It is so overrated but the world has been led to believe it is something it isn’t – just like Hollywood. A fool and his money are soon parted, bye! bye! or as the LA crackpots who love to pretend they are something they aren’t say TTFN – Ta Ta For Now
November 5th, 2008 at 3:52 am -
Ted said:
I’m continually wondering why the analyses of where the home market will bottom out always starts with the high point in 2005-06 and estimate down. Seems like going to a car dealer and negotiating from the sticker price. Rather, why not look at median home prices in 1999-2000 and simply figure a 4.5-5% annual rate of increase to 2008. That equates to about 45-50% increase over the 2000 price – analogous to starting with the dealer’s cost and negotiating up!
November 5th, 2008 at 3:56 pm -
Peufeu said:
WHOA ! Look at those home loans rates !
The bubble’s main cause is cheap credit + idiotic “smart growth” policies restricting homebuilding and adding long building permit delays in the feedback loop between demand and offer.
November 6th, 2008 at 10:32 pm -
bc said:
I moved from Nor Cal to LA. I feel like I overpaid in 2002 for my NEW 1475 sqft home of $230k in Nor Cal. It went up to $450!!….now back to $280. Now in LA, they want me to pay $450k for a 25 yr old 1000 sqft apt turned condo with HOA of $250/month and no garage and termites. I decided to rent for $2000 instead. Somehow, I still feel like I’m getting ripped off. I’m an engineer and I can’t afford a crappy home? Something is wrong.
November 7th, 2008 at 3:20 pm -
leroi said:
I totally agree with bc. When I moved to San Diego two years ago I had the same feeling. It just didn’t make sense that I was not even close to being able to afford a basic home here, despite having a good engineering job and working spouse. We’d drive through the suburbs wondering who could afford all of these houses. I guess now I have my answer … not many folks really could.
November 21st, 2008 at 8:01 pm -
EarlT said:
Blame Congress
Every house sold since 2000
when Congress Pressured
Fannie Mae and Freddie Mac
to relax Lending criteria,
that caused resulted in Mortgage lenders
loaning on 600k houses
to people that could afford only
200k houses.In 2000 median Calif house 180k
In 2005 median Calif house 600kSo what will happen is:
House prices should Drop to 180k
back to normal lending practice,
but due to Foreclosures
and the Law of Supply and Demand,
Prices should drop to @ 20% below 180k
then factoring in the Economic Crisis,
Median prices should drop another 20% to 120k.
This estimate is Conservative.That is Median price not low end.
Think Not?
Average 2008 Detroit house price only 20k.
http://mjperry.blogspot.com/2008/06/average-sale-price-of-house-in-detroit.html
January 11th, 2009 at 9:16 pm -
Surviving A Recession said:
Wow a really fantastic article. Great analysis. I think real estate is way over priced. And, until home prices equalize with the reality of true income prices will continue to slide. All this talk, by the pundits, about supporting home prices is self defeating. If incomes do not support the price then no one will buy.
I think we have a long way to go in a lot more markets than just California.
Beau
February 24th, 2009 at 1:19 pm -
FYI said:
Development of new inclusive Chart/Graph (using your existing graph/chart above as the basis for much of it).
An “all-on-one” median housing price; median home price to median income ratio; median family income; graph could be developed as follows if the remaining data can be obtained (and graphed).
The chart would have an x-axis (time) displaying the years 1970 to 2009 (better 2010) at a minimum. (If data are available, the earliest year could be 1965 or before).
The left-hand side vertical axis would run from $0 to $600,000 (dollars).
The right-hand side vertical axis would run from 0 to 10 (or 11-12 as necessary) to display the median home price/median family income ratios for the years 1970-2009.
The missing data needed are:
Median family income for the U.S. and California over the years 1970-2009 (non-inflation adjusted).
Median home price/median family income ratios for California for the years 1970-2009.The other graph/data are contained in the item below.
US Existing House Price / Median Family Income By Barry Ritholtz – February 20th, 2009
http://www.ritholtz.com/blog/2009/02/us-existing-house-price-median-family-income/
‘U.S. Existing House Price (Case-Shiller)
div by Median Family Income (1965-2009)’November 27th, 2009 at 1:41 pm -
renter said:
Great analysis. I live in OC and opted not to be a causality in 2004. I simply couldn’t make the numbers work like the lender was telling me they would. They encouraged, “just eat PB&J, it’s ok if you don’t have furniture, get a roommate”, etc. But no matter how I added it up, I didn’t see the mortgage, property taxes, HOA, as supportable if something should happen to my job. Everyone, the media was saying “buy before you miss out”. I was looking at “homes” (apts really) at $440,000-635,000) Thank God I heeded the facts and since then I have been laid off twice. Still renting in 2010 but not bankrupt or homeless. It’s not enough now to have the money to buy, you have to –whether or not you buy a house– have savings to live knowing your job most likely will not last or be subject to furlough. Something my parents never had to consider. They had their job as long as they wanted and retired from it and paid off their house way before then. Thanks for part 1 of my savings plan for 2013!
January 5th, 2010 at 2:25 pm -
Frank said:
Being over 50 and having grown up in California, I’ve observed firsthand how housing got out of hand. Speculation, greed an a compliant Government.
Now we see the first signs that a majority of the population, instead of being benefited from increasing values, is in reality being hurt by those unrealistic valuations.
And why are property values still so high? Its because politicians have been bought off by forces keen to keep valuations high.
Bottom line people…….. carefully vet the politicians you elect. Too many of you simply voted for someone who offered to give you something for nothing. Never mind fairness, or your own children.
As long as it apparently gave you “free” money (in the form of wild appreciation) …..you supported it. Now comes the time to account for it.Ain’t no such thing as something for nothing.
April 8th, 2010 at 8:05 pm -
Dan Sullivan said:
The biggest reason California housing is unstable and unaffordable is the undertaxation of real estate. Even before Proposition 13, special tax breaks for farm land and for “clean and green” holdings attracted speculators from all over the world. Low taxes on real estate are also offset by high taxes on everything else, driving jobs out of the state.
Nationwide, there is a strong correlation between property tax rates and housing affordability. The higher the property taxes on unmortgaged properties, the more affordable the housing stock.
Californians are paying triple for shifting away from property tax. First in other taxes, second in higher house prices, and third in mortgaged interests.Texas, which has high property taxes and low taxes on productivity, has the most affordable housing in the nation, despite their strong population growth. Austin, the least affordable city in Texas, is still more affordable than Bakersfield, the most affordable city in California.
Google “”property tax rates and housing affordability” for a complete list of cities grouped by population, property tax rates, and housing affordability at the peak of the housing boom.
March 25th, 2011 at 6:32 am -
Dan said:
About ready to retire soon. I Thought Big mistake, I would go down to california, Living in Oregon and spend a few months down there check out the economy and perhaps find a place to relocate or at least winter there. OMG a average apt. starting around $1700/mo. Are you fri&%%$#ing Crazy??? How in the Heavens name do you survive ???? $1700/mo. In Oregon would get you 18 to 20K sq ft. home. I know it rains here in the winter and you do have more sunshine, but is it really worth spending that kind of $ to just live. ??? Help me understand, whats the enticement??
June 10th, 2012 at 9:34 pm -
Michael said:
House prices are high because the fed dollar is backed by homes. You have low wage earners getting into homes with no jobs. Artificually inflating home values for people to spend money. Do you know what it is like to see a grape picker driving a hummer. Do you know that tax debt and mortgage debt and school loans are not dischargeble. I know 5 co workers who owe the irs 500000 plus.
June 9th, 2016 at 11:40 am


 If you enjoyed this post click here to subscribe to a complete feed and stay up to date with today’s challenging market!