Employment a Lagging Indicator? Not Always. Using Outdated Economic Data and Trends for Future Financial Models. Just Because Stocks Rebound doesn’t Mean the Fundamentals are Good.
- 2 Comment
The markets are continuing on an unrelenting upward movement since their March 9th lows. This is a strong rally that has now seen the S&P 500 jump up by 25 percent in the matter of a few weeks! This kind of market volatility is reserved for highly volatile and troubled markets. It is a rare occurrence to see this kind of quick burst to the upside in more stable and solid bull markets. In addition, the rally is being spurred on by “not so bad” news while the core economic fundamentals are still horrible. Take unemployment for example. This is probably the best indicator of how people and families “feel” the actual recession. The fact that the market is now up 25 percent does very little for the average American family.
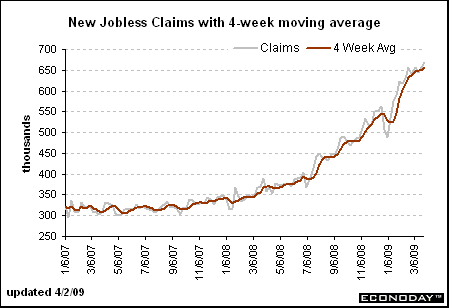
Let us take a look at jobless claims:

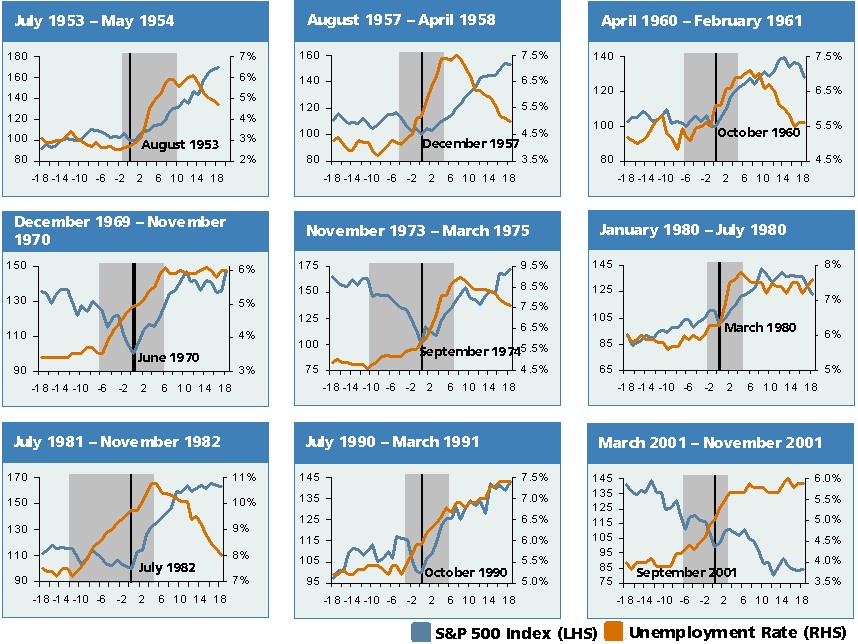
As you can see from the chart above, jobless claims are moving up on a continual basis. Unemployment insurance claims are at the highest ever. On a percentage basis, we are already getting into the 1982 recession territory which signals that this has further to go. But there is a new mindset making the rounds. And that is an assumption that the stock market always rebounds and bottoms before the unemployment scene. This is the case for many previous recessions but that is assuming that this recession is standard and falls in line with those historical trends:
*Source:Â Zero Hedge
That isn’t always the case necessarily. Take a look at the above chart which has recessions measured with unemployment and the S&P 500. In most cases, it is true that the S&P 500 hits bottom first and unemployment keeps rising before topping out. Yet this can mean many different things. We already expect unemployment to be at least 9 percent nationwide and we already know the U-6 which is a more accurate measure already has unemployment near 15 percent. So the argument that unemployment is a lagging indicator is true but the way the market is reacting is that the 2nd half of the year will have us in full recovery and assuming this recession is one of your typical bread and butter recessions. It is not. This is at levels unseen since the Great Depression and there are many reasons to believe we have yet to see the actual bottom even in stocks. The market is currently rallying because of:
-$1 trillion via the Private Public Investment Program
-$700+ Billion Stimulus Program
-$700 Billion TARP
-$10+ Trillion in commitments to the markets through various programs
Yet the fundamentals are still lagging. If this plan doesn’t work, we have just assured ourselves of a Japanese style decade long stagnation.
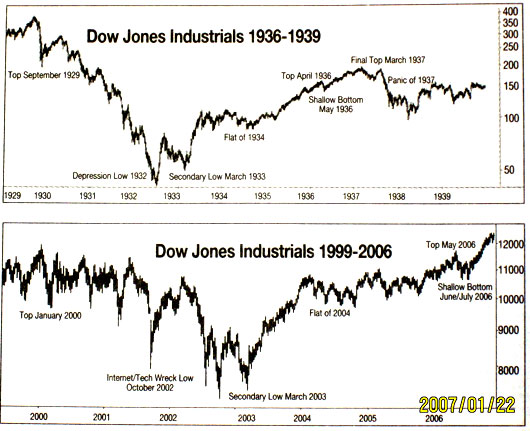
The above chart is very telling. But let us look at the Dow during the Great Depression:
*Source:Â StockBlogs
This chart helps put things into a nice perspective. Keep in mind unemployment was extremely low in 1929, peaked in 1933 and remained high (+15%) until our involvement in World War II in 1941. And even though the market rallied off those 1932 lows, it took almost 25 years for the Dow to see that 1929 peak once again. Are you willing to wait 25 years to see the S&P 500 back up to 1576 or the Dow hitting 14,000 again? That is the perspective you need to take. And we are still in that period where unemployment IS rising. We have yet to see any peak in that regard. And it would be too early to say that the 676 S&P 500 of March 9th was the actual low of lows. Who really knows? Yet first quarter earnings are coming out soon and with the mark to market accounting being eased, we can expect some major fudging to go around. So we may see companies firing people left and right yet earnings will somehow be mysteriously good. Keep an eye on the fundamentals. This time is different.
If you enjoyed this post click here to subscribe to a complete feed and stay up to date with today’s challenging market!2 Comments on this post
Trackbacks
-
Gastone Ciucci Neri said:
Unfortunately the prospect of a V shape recession is fast fading away, instead we must expect a long L shape recession . There are still too many debts around the world that need to be paid back. The only way to do so it is to deleverage every assets and this will keep , for the foreseable future , a lid on the global economy. It does not matter the amount of quantitative easing that the world central banks will inject into the financial systems and how much they will expand their balance sheets , the recession will not end until the deleverage process will be over.
This is not a crisis within the system , this is the crisis of the systemApril 20th, 2009 at 10:41 am -
Henry Delforn said:
One specific and clear example why any employment index is indeed a lagging indicator in a recovering economy is given below. I challenge anyone to provide a more specific and a more clear example.
The Catch-22. It’s simple logic: to pay your bills you need a job, but to get a job you need to have a good credit record, but to have a good credit record you need to pay your bills.
It is only after this catch-22 situation is somehow overcomed that an employment index will begin to confirm a growing GDP.
Henry G. Delforn
Carpinteria, CAJune 18th, 2010 at 11:20 am


 If you enjoyed this post click here to subscribe to a complete feed and stay up to date with today’s challenging market!