The failed recovery in 9 charts: 9 charts highlighting the lackluster performance of the economy.
- 0 Comments
The mainstream press simply measures a recovery by looking at the stock market even though very little of the gains here are trickling down to regular families. It should be noted that many Americans are frustrated with the economy because to them, it still feels like a recession. Low-wages permeate the landscape, housing costs are jumping, college tuition is off the charts, and saving for retirement seems like a distant dream. Those clustered away in bubbles may feel that this is not the case but there is clear evidence highlighting how weak this recovery has turned out to be. There is a reason that we now have a boom in dollar stores across the nation. The top occupations across the country pay $10 an hour or less and carry very little in the way of benefits. Let us take a look at some charts to show what this recovery truly looks like.
9 charts of the failed recovery
A reader emailed a chart over that highlighted the plight of the middle class in 9 simple cases. Most Americans realize that having a stock market bubble built on easy credit is nothing special. That is what led us into the first financial crisis. However, the first financial crisis allowed regular American families to participate even though many were destroyed once the crash hit. This crack-up boom was largely a bailout gift to the banks and financial institutions. They juiced up stocks and many bought up real estate at rock bottom prices thanks to generous financing from the banking system. The same system that allowed middle class families to leverage to the hilt is essentially taking over their properties on the cheap with bailout funds.
Let us take a look at this summary:
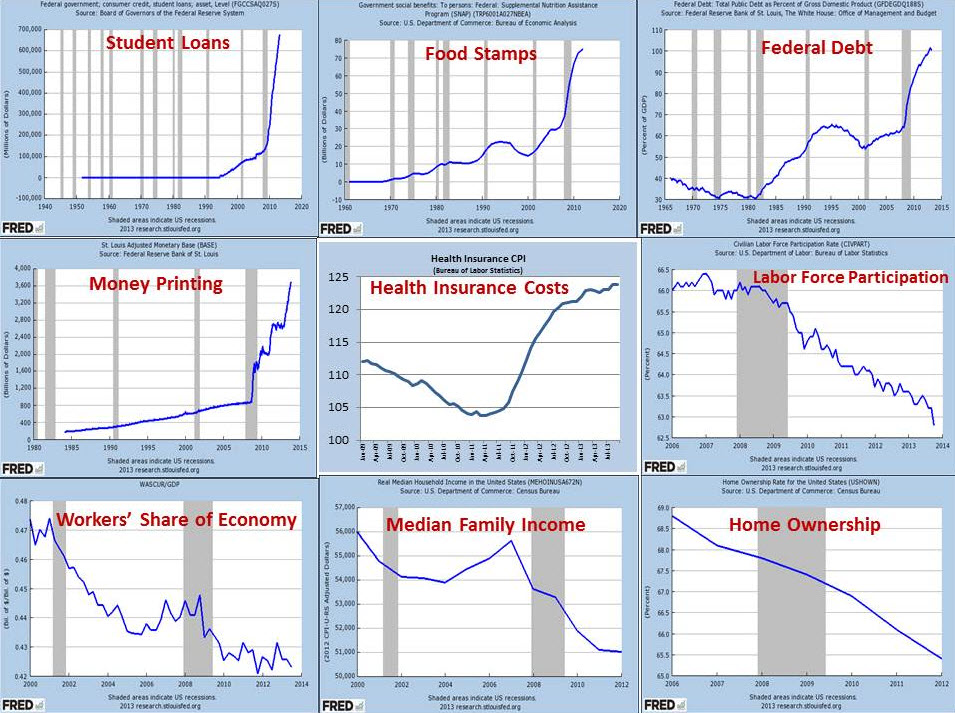
It is worth going through each one individually:
-1. Student loans – we now have a record of $1.36 trillion student loans outstanding. The biggest non-housing debt sector in our economy.
-2. Food stamps – Over 46 million Americans are in poverty (a record percentage of our population). Dollar stores suddenly sold a bulk of their items as food and many are using those EBT debit cards to pay for daily food. How is this a sign of economic prosperity?
-3. Federal debt – the Federal debt continues to grow unabated. Will we ever pay this back? #LOL
-4. Money printing – more like digital debt printing. Inflation is real even though the Fed chooses to minimize its impact. Things now get inflated via forced usage of credit (i.e., mortgage, auto loans, student loans, etc). This gives more power to banks.
-5. Health insurance – health insurance costs are soaring despite new measures to control it. Employers are chopping away at healthcare benefits and pushing the responsibility onto workers. End result? Families are paying more to stay insured.
-6. Labor force participation – this is how you get the unemployment rate to look good without making a better economy. 94 million Americans (a record) are now part of the “not in the labor force†category.
-7. Workers’ share of the economy – wealth is being aggregated in fewer hands. Workers are keeping very little of their spoils as the middle class is slowly erased off the history books. Profits flow up to a narrower pyramid.
-8. Median income – median family income is back to where it was nearly a generation ago, adjusting for inflation. This is why families feel poorer. Inflation is real. Is college tuition more than 30 years ago? What about housing costs? Health care?
-9. Homeownership – the homeownership rate is near generational lows because of the foreclosure crisis. No recovery here. Investors bought a large portion of homes through big connections with banking buddies. End result? The one vehicle where most Americans build wealth was siphoned off to the new rentier class. Rents are higher and so are housing costs even though incomes are stagnant (see number 8).
These are all up-to-date charts. So does this seem like a good recovery to you?
If you enjoyed this post click here to subscribe to a complete feed and stay up to date with today’s challenging market! If you enjoyed this post click here to subscribe to a complete feed and stay up to date with today’s challenging market!Â