How 56.5 Million Households Live: $52,000 Median Household Income in 2009 Crushed by a Decade of Debt. A Decade of Lost Wages and Financial Debt Servitude.
- 9 Comment
The recent American Consumer Survey had some thought provoking data regarding the typical American household. Wages over the past decade have been stagnant. At least that is what is propagated in the common datasets but in reality, not only has income not grown it has actually declined. The U.S. dollar during this time has been crushed as well. So incomes moving in a horizontal fashion may appear to be steady for Americans, but in reality the purchasing power has fallen due to inflation (not recently) and the declining dollar. Think of the rising cost of housing, healthcare, food, and automobiles. In the last decade, even after the housing bust, prices are still higher yet incomes still lag.
Americans leveraged debt in this decade to make up for their lost purchasing power. Access to debt is now being limited. But let us first look at a crucial aspect of the typical household that seems to be missing from the mainstream financial press, household incomes:
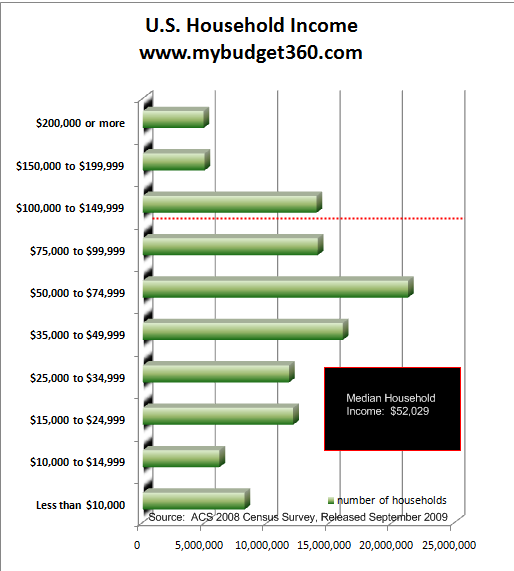
This is the latest data we have and we should spend some time on the above chart. 20 percent of American households make more than $100,000 per year. The median income is $52,029. In other words over 56,500,000 households make due with $52,029 or less per year. This is the average American consumer and also helps to explain why things are still in a troubled state. I put together a budget before for someone making the median income and given the updated income figure, things haven’t changed much.
Keep in mind the above data reflects the 2008 year. A troubled year no doubt, but we have yet to factor in the increased unemployment brought about in 2009. This data will be reflected in September of 2010 and we already know that incomes are going to fall yet again. With 27,000,000 Americans unemployed or underemployed, we know the recession is deep and pervasive. But what is usually missed, is even the employed in those 56.5 million households are struggling with rising costs of healthcare and education. Housing costs may be going down but not because of a healthy economy. What we are seeing is debt destruction.
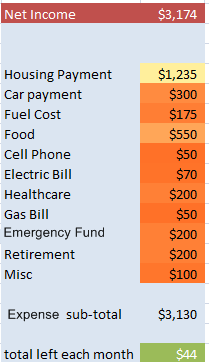
Now try to factor this out with a real world budget:
We’ll go with the state of Georgia just as an example. After taxes the median household is netting roughly $3,200 per month. In August, the median home price in the United States came in at $177,700. Now run the numbers on a FHA insured loan here with a 3.5% down payment:
Home Price:Â Â Â Â Â Â Â Â Â Â Â Â Â Â Â Â $177,700
Down payment:Â Â Â Â Â Â Â Â Â Â Â $6,219.50
30 Year Mortgage Amount:Â Â Â Â Â Â Â Â Â Â Â Â Â Â Â Â Â $171,480.50
PITI:Â Â Â Â Â Â Â Â Â Â Â Â Â Â $1,235
We’ll leave aside the $8,000 tax credit for the moment. So let us run a simulation on this budget since this on the face seems to workout:
Before you start picking the budget apart, keep in mind this is only a sample. If you look around your own neighborhood, how many people do you see with two relatively new cars? A flat screen TV? Designer clothes? The above budget doesn’t allow for that. And that is why we are seeing bankruptcies also rising in the current environment. The spending was done outside of the budget via credit cards and other forms of revolving and non-revolving debt.
Credit card companies are quickly jacking up fees, putting onerous terms, and decreasing credit available to a consumer that is losing income. You can see how quickly things can get out of hand. Take for example the budget above. What happens if one spouse loses their job? The net income will fall but expenses will stay the same most of the time. Or what about a medical emergency? One night in a hospital can wipe out one or two years of an emergency fund without insurance and millions fall in this category. What if the car busts the transmission? There goes $2,000. Things can escalate quickly without access to the easy debt machine that hid a decade of lost income.
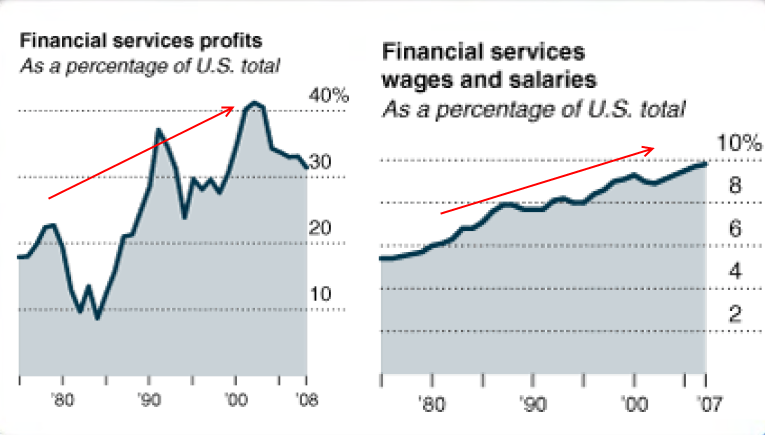
But a sector that did do well in this time is the financial sector:
Source:Â New York Times
The financial sector has cannibalized a large part of our economy. After decades of bubbles and mismanagement, what have they left the average American with aside of the mountains of debt? We have $3.5 trillion in commercial real estate debt to contend with. Household net worth in the U.S. has fallen by over $12 trillion since this crisis started. It is hard to see what benefit the financial sector has brought to the typical American family. It gave people the illusion of wealth through debt but as we are now seeing, is quickly taking it away via bankruptcies, foreclosures, and yanking credit cards away. I agree that many Americans over spent and now many are paying the price. But what price does Wall Street pay? In fact, they are rewarded with bailouts.
The notion that things are getting better is hard to understand. If we mean that things are better because Wall Street is up, then yes, things are better. But jobs are still not on the horizon and most people associate employment with a healthy economy:
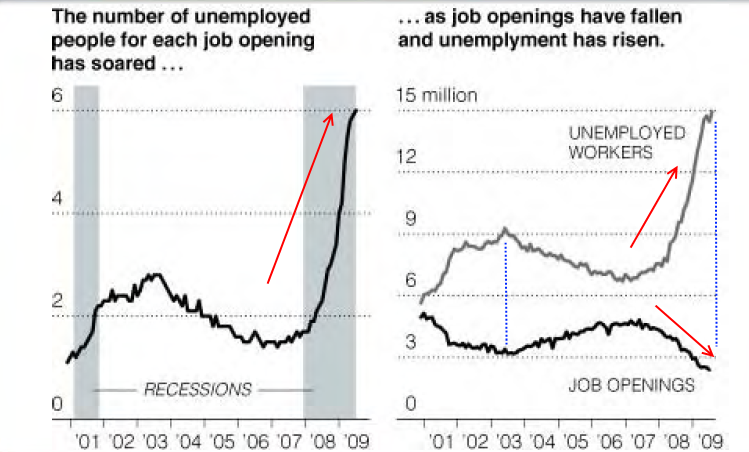
During this earning season what is rarely reported is that the jump in profits with many companies is coming from one time inventory replenishment and also, by cutting your largest cost. Employees. Look at the above chart. For every job opening you have six people trying to fill it. And job openings are below levels at the start of the decade and we have more people in raw numbers plus, we have the 27 million unemployed and underemployed Americans. Just to replenish the lost jobs since December of 2007 we would need to find 8 million jobs. Even if we added 150,000 jobs per month starting in November (not happening) it would take us over 4 years just to get back to where we were at the start of the recession.
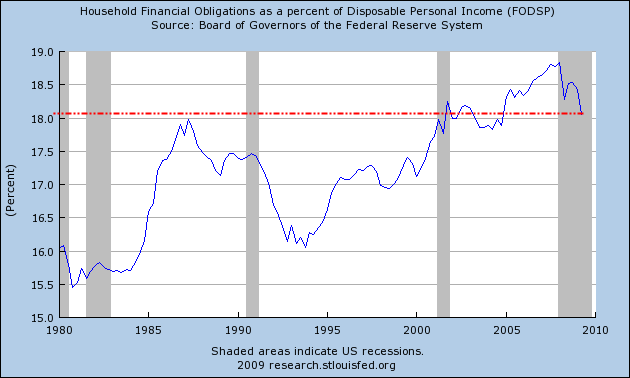
Even after all the debt destruction, household debt is still weighing like an albatross on the American household balance sheet:
The above chart is important because it shows the stickiness of debt. That is, unemployment has been going up since December of 2007 but debt goes down slowly. The amount of workers in the U.S. economy is seeing a sort of lost decade. But look at the financial obligations above. We are only back to 2005 levels. The bubble started much further back. Why is that? As we now know, a foreclosure takes a very long time while being laid off can happen in one day. Those mortgage payments keep coming in while the income from work is cut off. It isn’t like the mortgage suddenly adjusts to reflect the real economy. The obligation is still there. So is the auto payment. And the credit card bill and everything else. So debt that was once seen as a supplement to income is now a massive drain on your monthly balance sheet.
Just looking at this data I’m not convinced of this job less recovery. We are still losing jobs at a rate of 3 million per year. In fact, just to keep at a normal pace we need to be creating 150,000 jobs per month. Until we get there, the average American is going to feel this as the deep recession that it is.
If you enjoyed this post click here to subscribe to a complete feed and stay up to date with today’s challenging market!9 Comments on this post
Trackbacks
-
t b said:
if you’re gonna use georgia as an example state, keep your expenses geared to georgia. the nation median price of a home doesn’t matter; what matters is the median price of a home in georgia.
October 29th, 2009 at 11:42 am -
t b said:
unemployment is about double the official lying govt numbers.
October 29th, 2009 at 11:43 am -
JJ said:
Where did you get this information from? No one I know makes $100,000 or even $50,000. At the height of my corp. “career” I was making $32,000 before taxes. I live in Manhattan and more than half of that went to pay rent, gas & electric, transportation, etc. And if I had anything left food. I also was a single parent. I think you are out of touch with real folks. Or the statistics you found have been “inflated”.
October 29th, 2009 at 3:46 pm -
KK said:
JJ: You think you are a pop star ? Just because you don’t know anyone making 50000 or 100000, that doesn’t mean that 20% of household income is higher than $100000.
February 28th, 2010 at 1:46 pm -
ACF said:
Maybe you didn’t read this part of the article:
“Before you start picking the budget apart, keep in mind this is only a sample.”April 20th, 2010 at 10:50 am -
Marshall Johnson said:
Everything is relative. Southern IL in a small farm town you can buy a 3 bedroom home for under 90000K. In Chicago you cannot touch a 3 bedroom home for under 250K. How do we accurately compare in a sample. I could live very well in S. IL but not well at all in Chicago area.
May 30th, 2010 at 8:43 am -
Chris said:
I feel the article is well put together, and I make around 75k (single income with stay at home dad for our son). The one part that I think may have been over looked is the rising cost in student loans that many American’s must take on in order to get over that 32k hump. That alone can be from 200-500 a month depending on the degree level and school choice.
June 15th, 2010 at 7:17 am -
kevin kwidzinski said:
i dont know why you people are ripping his budget and other things apart. the bottom line is the great usa is no more. china will be the leading manufacturer if not next year the year after. the dollar is going to crash. just look at the price of gold. we in our time are going to see the greatest depression of all time in every part of the world. when the dot com bubble burst in the early 2000’s what did the government with greenspan at the time in charge of the fed do?? dropped interest rates to 1%.instead of raising interest rates to have a recession and cleanse the system, they made it worse by letting people go out and spend like never before.we are the worlds largest debtor now. we used to be the largest creditor. 70% of the gdp is consumption we are not producing. if you continue to print money backed by nothing and producing practically nothing it will destroy the economic system. that is what’s happening. the only way to get out of it is to produce as a country.with our government i really don’t believe that will happen.
June 22nd, 2010 at 5:42 am -
R sterlin said:
This article is a plain look at what we are facing, we must go back to essentials and some saving. This recession will be longer because we do not have the manufacturing base of years past. Good article.
September 19th, 2010 at 1:06 pm
