Investing in the S & P 500: Is the Market Really at a Bottom? Examining data from 1936 through 2008. Stocks Still Overpriced even after $6 Trillion in Market Cap gone from the Index.
- 0 Comments
Investing in 2008 has been anything but easy for most Americans. The economy officially entered into recession in December of 2007 and ever since, we have experienced the strongest volatility ever recorded. Extreme market volatility as I had discussed in a previous article is a telltale sign that the market is in severe distress and is not an indicator of market health.
On Friday, the unemployment report came out and shocked to the downside. Most analyst were expecting the unemployment number to come in at -350,000 when the actual number was -533,000 jobs lost. This sent the Dow 30 down over 200 points yet at the end of the day, the market ended up strongly by 259 points. The S & P 500 which is a better measure of the overall economy, went up 3.65%. When we see action like this, it is hard for many not to begin to look for a bottom.
I would argue that a bottom is far from here. Even looking at economic fundamentals with employment and sector growth, the country is set for a powerful contraction.  $50 trillion has already disappeared from the global economy since the peak in October of 2007. Today we are going to look very closely at the S & P 500 and try to determine whether it is a smart time to invest in the broader markets.
First, let us take a look at a graph of the S & P 500 since 1936 through 2008:
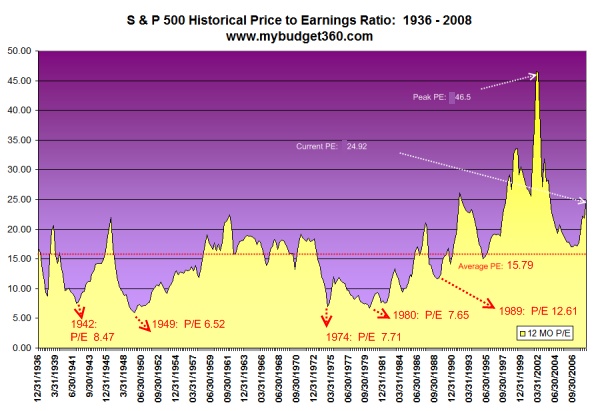
Looking at data since 1936 the average P/E for the S & P 500 is 15.79. The current P/E for the market looking at second quarter data is 24.92. Since that time, the P/E has started to look more attractive but you have to be cautious as to why this is occurring. First, the current P/E ratios are betting that earnings will not take hits in 2009 which they clearly are. The formula itself looks at a stock price and measures it to earnings. Well as you know, many companies are reporting weaker and sometimes no earnings. This obviously is going to hurt the overall ratios and makes what looks like an attractive investment, a bottom trap.
If you think it can’t go lower take a look at some of the historical quarter lows:
1942:Â 8.47
1949:Â 6.52
1974:Â 7.71
1980:Â 7.65
1989:Â 12.61
The current P/E for the S & P 500 as of 12/5/2008 is 18.01. This may start looking attractive because earnings for the most part are being projected the same by numerous companies. This of course is inaccurate. So what you have, is over the past year the price going drastically lower while earnings have yet to catch up. This is where the economic fundamentals come in. Clearly earnings come from a vibrant economy and losing the most jobs in 34 years is going to force many of these companies to cut back. Let us look at how the S & P 500 is broken down:
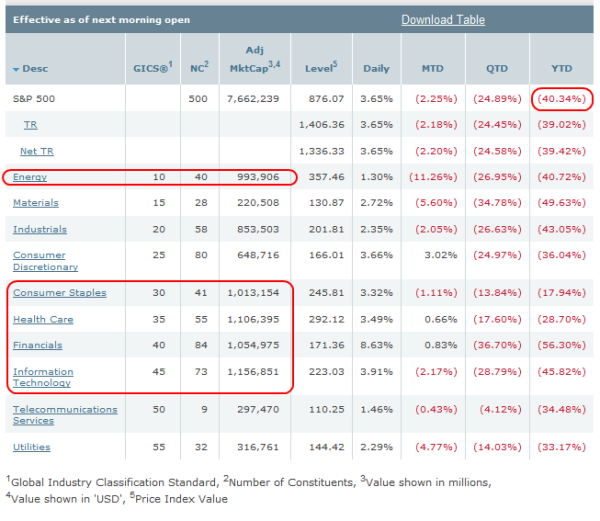
The S & P 500 is made up of 500 leading companies in leading industries of the U.S. economy. Companies have to have a minimum market capitalization of $4 billion to make the index. Most regard this as a better overall gauge of the U.S. equities markets than say the Dow 30 components which only reflects 30 companies.
You can see in the above chart that 5 of the heaviest weighted sectors will be facing difficulties in the upcoming year. If energy prices stay as they are because the menace of deflation goes longer than expected, this will cut deeply into earnings. Consumer staples? Early reports are showing us that consumers are tapped out and spending on more necessities as opposed to want goods. Could it be because the United States is looking at over $50 trillion in debt and is maxed out? This sector will be contracting as well. Health Care? This may be one of the few areas that does hold up but people in tough times cut back no matter what. Financials? Well this area has been the hardest hit and it is easy to understand why with the bursting housing bubble and the destruction of equity and credit markets over the past year. IT? Take a look at the NASDAQ and you’ll see how they are doing. AT & T just announced it will be cutting thousands from its workforce. This area will contract as well.
So what does this all mean? Expect lower earnings. So even though the index price has been declining (after all the S & P 500 is down over 40% for the year) it is no bargain. Even if we assumed a healthy economy, the price is no bargain. Throw in the fact that we are in recession and you can understand why the S & P 500 is still overvalued. We haven’t even come close to the historical P/E of 15.79 which includes good times as well.
Here is an easy way to wrap your brain around this. Wal-Mart has been holding up well since they sell needed daily goods which consumers will always need. They are up for the year 22%. Their current stock price is $58.21. Their last earning per share number was $3.42. So they have a P/E slightly above 17. So even Wal-Mart who if we look at both economic and stock fundamentals, is priced to withstand the recession better than many other companies in the S & P 500 is still lower priced than the overall index at 18.01! What does that mean? The S & P 500 is still over priced.
Let us take a quick look at the damage:
S & P 500 Market Cap:
October 12, 2007:Â Â Â Â Â $13.75 trillion
December 6, 2008:Â Â Â Â $7.66 trillion
A drop of $6.09 trillion in market cap in a little over one year and the index is still overpriced. Shows you that we had more bubbles than simply the housing bubble going on here.
If you enjoyed this post click here to subscribe to a complete feed and stay up to date with today’s challenging market! If you enjoyed this post click here to subscribe to a complete feed and stay up to date with today’s challenging market!