US median household income trap: Four decades of data and households struggling to keep up with inflation. Younger Americans face bigger income struggles.
- 3 Comment
Household income growth in the US has largely been absent for well over a decade if we adjust for inflation. This is important because people truly care about what their money can purchase. What use is it getting a $1 raise if healthcare went up $2? What use is it that you are earning $1,000 more a year when sending your kids to college now costs $5,000 a year more? It is unfortunate so little attention is given to income growth when the available data is readily available. Part of the lack of coverage probably stems from the reality that the mainstream press is largely an advertising vehicle.  Do not hold your breath for deep analysis and reporting from the press. Telling people how their inflation adjusted incomes are back to 1990s levels isn’t going to encourage people to go out and buy that new car, fancy tech gadget, or go into heavy debt for that new home. Let us dive deep into the income data.
Where we stand with household income
The first chart we should look at is the median household income chart:
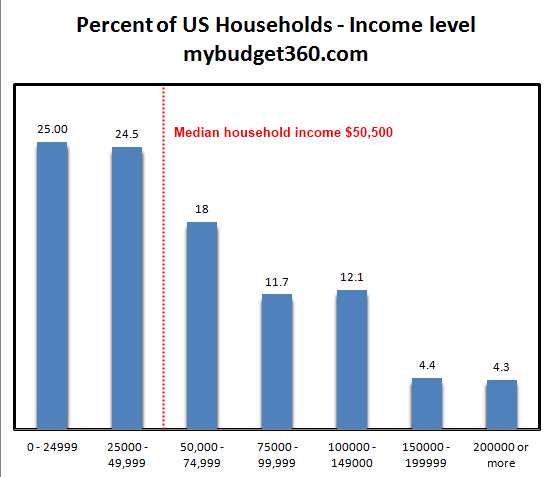
Source:Â ACS, Census
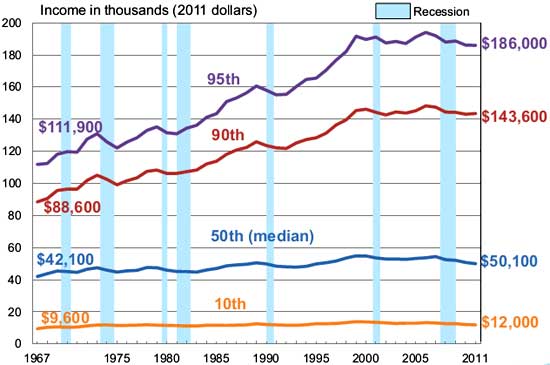
The median household income in the US is $50,500. The next chart we should look at is both nominal and inflation adjusted household income growth:
Source:Â Dshort.com
This is a very important chart. Adjusting for inflation, Americans are much poorer than they were in 2000. Nominal growth is only useful if it is increasing at a faster pace than inflation. From 2000, the CPI itself has increased over 30 percent. Even to keep pace with the CPI, the median household income today should be at roughly $55,000 (we are 10 percent below that). If we go further back, we will realize that household income would need to be much higher to account for decades of stagnant growth for most Americans.
It is problematic when household incomes are growing so slow. When examined on a longer term horizon, you will realize that only the top 10 percent have really seen real income growth over the last 40+ years:
Think of how quickly the price of many items has increased for the last few decades:
-Healthcare
-College tuition
-Housing (home prices / rent)
-Food
We are also contenting with a large part of our population now receiving food stamps. Over 47 million Americans are now receiving food assistance. We have a growing number receiving Social Security as they enter retirement. A larger strain and burden is being placed on younger Americans to support these changes. Younger Americans are also carrying the heaviest burden with student debt and weaker employment prospects. Half of college graduates are underemployed or working at jobs that do not even require a college degree. Many can no longer support the debt they have taken on to pursue their education:
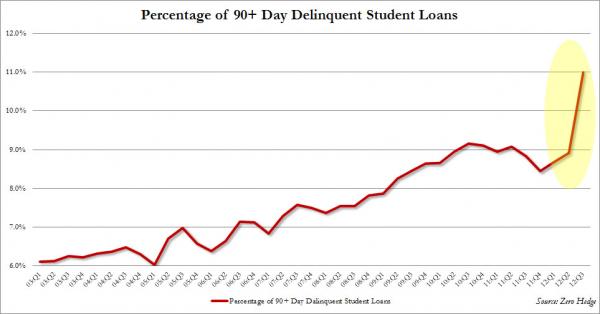
The number of student loans 90+ days late is now 11 percent of the entire pool of loans. This is incredibly high given that we now have more than $1 trillion in student debt outstanding.
Americans do not earn as much as some would think. The below is data from the latest Social Security data:
151,380,749 wage earners (had earnings in 2011)
50 percent of US wage earners made less than or equal to the median wage, estimate to be $26,965
66 percent of US wage earners made less than or equal to $41,211.36
The median wage in the US per person is $26,695. Since the recession hit, and for well over a decade, real income growth has severely contracted:
Those claiming that incomes are rising are clearly mistaken or have a vested interest in pushing out that agenda. Just because nominally something went up, does not mean people are better off. From what you can see above, even in a nominal perspective things are not healthy on the household income front.
If you enjoyed this post click here to subscribe to a complete feed and stay up to date with today’s challenging market! If you enjoyed this post click here to subscribe to a complete feed and stay up to date with today’s challenging market!
3 Comments on this post
Trackbacks
-
fred said:
Can you analyze the CPI numbers and what the goverment has taken out to make inflation lower like housing, health care and college tuition.
January 13th, 2013 at 8:09 am -
ame said:
Concerning the median income in 1967 vs. 2011:
In 1967, $42,100 was typically the income of one person, a man, who supported his wife and 2.3 kids. Whereas, $50,100 in 2011 is typically the income of two adults supporting themselves and 1.4 kids.
Inflation not considered in this article…Americans are truly poorer in their family life, not just their financial life. Not only do they have less children because of costs, but those children are receiving lower quantities of personal parental attention because of the necessity of daycare.
January 14th, 2013 at 11:09 am -
KENNY G said:
Lord help us
January 15th, 2013 at 8:50 am