S&P 500 Overvalued by 100 Percent: Estimated Price-Earnings Inflation Adjusted Ratio does not Reflect Actual Earnings. VIX now Back to August 2007 Levels. Bank of America P/E Ratio over 500?
- 3 Comment
It is hard to justify the 1,100 mark for the S&P 500. The 676 low of March, as disastrous as it may have felt, actually reflected a more accurate measure of earnings potential of the 500 S&P companies. The S&P 500 is a good index because it measures 500 companies with a current collective market cap of $9.6 trillion. The S&P 500 over a century of data has seen price to earnings ratios of between 5 and 10 after severe contractions. It is safe to say that what we are experiencing is a strong contraction.
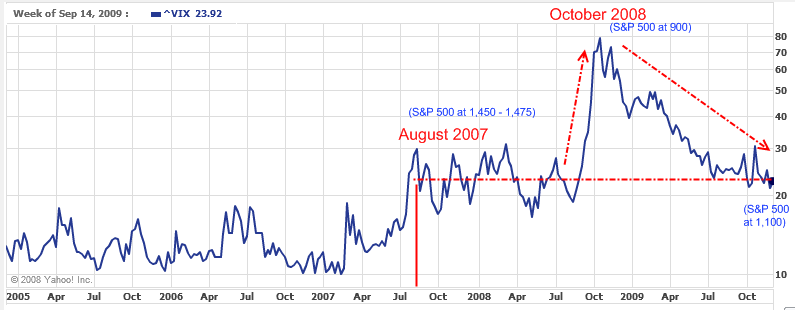
It is troubling to see a sudden complacency entering into the market. The VIX which measures option volatility is back to the point reached in August of 2007, right when the crisis ignited:
The VIX was in the lows 20s in August of 2007, traded within a range until August of 2008 then exploded in October of 2008 and remained high until March of 2009. Suddenly, we are back to levels seen in pre-crisis mode. Even if we are to assume a recovery, are we really at a volatility level that justified a peak S&P 500?
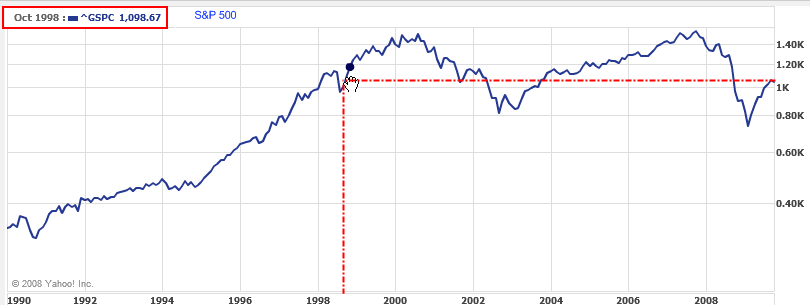
Given all the movement in the market, it is hard to accept that we have been merely running the Red Queen race for over a decade. Running faster and faster only to stay in the same spot:
The level we are at today was the same as it was in October of 1998. A lost decade when we factor in inflation adjustments. But over this time we have gone through two busted bubbles in technology and housing. The housing bubble was the ultimate culmination because it also popped the consumer oriented debt bubble. A new austerity is being forced on many Americans as they come to terms with a debt induced economy.
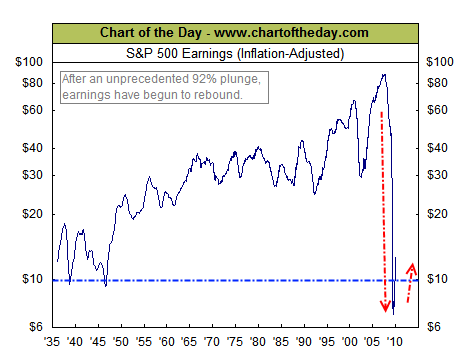
To comprehend the drop in earnings it is important to put the overall event in context:
Source:Â Chart of the Day
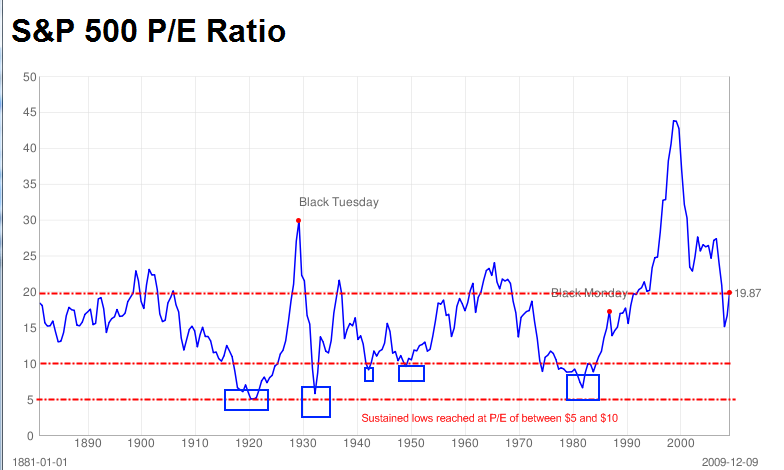
For the first time ever did S&P 500 earnings go negative for a quarter. This recession actually caused across the board losses to bring the earnings negative. It has since rebounded but adjusting for inflation we are merely at Great Depression levels. Is this cause for celebration? For the moment, the current S&P 500 P/E ratio puts us at approximately 70 which is fantastically high. If we use a broader valuation of ten year intervals we find that the current S&P is still over valued by 100 percent:
The above data comes from studies by Robert Shiller. As you can see, after most severe downturns the P/E ratios hit a trough in a tight range of 5 and 10. Our current 20 moving trend is high by 100 percent. If we were to use a top line P/E of 10 then the S&P 500 should be valued between 500 and 600 as it was in March of 2009. Until we see real significant jumps in earnings, most of this is just hype.
Keep in mind much of the gains come after a horrific 2008. So anything above zero is going to look like a gigantic jump. The fact that inventory depletion caused a void that is now being filled causes the market to over react. Plus cutting fixed costs like employees helps the bottom line in the short run. Yet the real mover of employment is still weak. 27 million unemployed and underemployed Americans. A large part of our economy is consumption based so how is this going to impact the bottom line of many companies in the S&P 500?
Take for example a diversified company like Proctor and Gamble:
Even Buffet’s mentor Mr. Graham would reject this bread and butter company:
“However, Graham also preached Margin of Safety. Therefore, taking this formula and allowing a 50% Margin of Safety you arrive at a P/E of 14.25 in the above example. Many value investors would take a hard look at a company with a 14.5 P/E growing earnings at 10% a year.”
Take a look at one of the too big to fail banks of BofA and the P/E is off the charts:
Even Wal-Mart has a P/E above 15. The point is, some companies like Wal-Mart are slightly overvalued given earnings but some of the hottest stocks in financials including BofA have P/E ratios with no justification.
Be cautious in this current market since current earnings do not justify the current S&P 500 level. We heard similar arguments back when the NASDAQ hit 5,000 and we know how that turned out.
If you enjoyed this post click here to subscribe to a complete feed and stay up to date with today’s challenging market!3 Comments on this post
Trackbacks
-
bill said:
It is not over valued in fact it is slightly undervalued….The S&P 500 to NIPA corporate profits is 1.06….the 60 year average for this
ratio is 1.25……in a low inflation environment (under 4% year over year) this ratio can be much higher….December 11th, 2009 at 2:34 am -
Terrance Stuart said:
Your data on the S&P is highly suggestive it is over priced. While it remains to be proven that we are rational in all that we do, is there any rational reason that investors are doubling up on the S&P? When do you see the dam bursting? What do you see as a trigger point?
December 11th, 2009 at 1:01 pm -
George said:
a few things:
1) I would be careful about using P/E gotten from googlefinance as they tend to be innacurate in many cases.
2) Stocks are very rarely valued off of current year p/e and usually at least one year forward p/e which will explain your inflated p/e’s that you list above. The more growthier the stock, the further out earnings are used for valuation. BAC may have a 500+ p/e ratio (which i dont find believable) for the current year, but it is closer to 10-20 for next year
3) your VIX argument is interesting, but you also need to throw in the fact that, the last time the VIX was at these levels, the S&P was about 30% higher than it is today.
December 28th, 2009 at 11:20 am


