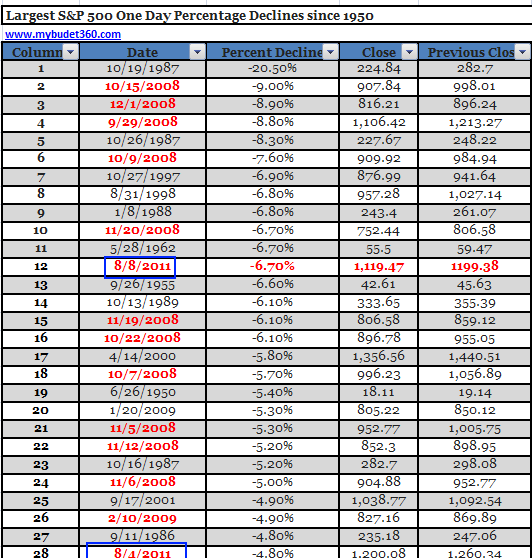
The rise of the new gilded age – Massive market volatility is a dramatic sign of an unhealthy economy – 14 of the 28 biggest percent declines since 1950 in the S&P 500 have come after 2008. Two of those volatile days have occurred in August of 2011.
- 1 Comment
Massive stock market volatility is not a good sign for the economy and like an EKG is telling us something is troubling the heart of the nation. The most tumultuous times in the stock market have occurred during times of great economic uncertainty. August of 2011 has quickly brought back the troubling memories of 2008 and 2009 when the economy was melting down like the Wicked Witch of the West. For the middle class the recent stock market rally was nothing more than a sideshow. The real underlying economy has been falling apart like pulled pork for years so it is no surprise that we are witnessing massive volatility in the stock market yet again. Drops of 600 points followed by surges of 500 points are not healthy. What one would expect out of a mature economy is steady and solid growth, not volatility that is reminiscent of a hot streak in Las Vegas. That is however a large part of the problem with our current financial system. You have many investment banks that thrive on this kind of volatility making billions of dollars on options, derivatives, and futures even if these tools increase the underlying risk in the real economy. For all of the drama of the last week, the markets were changed only by one percent but the rapid reversal is signifying that market volatility is back in fashion again.
Big losses during economic bad times
Below is a chart of the biggest percent declines for the S&P 500 since the 1950s. If you have any doubt that this is the worst crisis since the Great Depression this should put those doubts to rest:
Out of the top twenty-eight biggest percentage decline days fourteen occurred from 2008 and after. 50 percent of the most dramatic days for the S&P 500 (in the last 60 years) have occurred from 2008 onward. In fact, eleven of those days occurred in 2008 alone. One day from 2009 makes the list but 2011 already has two of those days (both in August by the way). These declines happened during the pangs of the Great Recession. The fact that we now have two 2011 dates back on the chart is not a good thing. This kind of massive market volatility reflects the uncertainty being present in the real economy where people make real things and consume real products. The Federal Reserve is running out of options and people are losing confidence in a central bank that is primarily concerned at protecting the interests of the too big to fail banks. These are the same banks that benefitted and largely caused the systemic risk that we are now facing. Where is the debate about real and serious financial reform in all this political theatre?
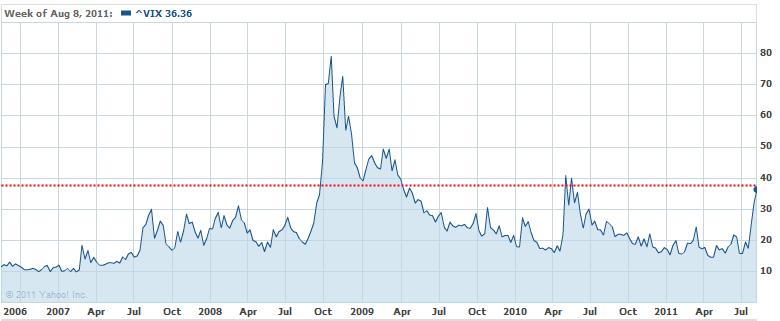
Market sentiment is shifting rapidly as the VIX indicator, a measure of market volatility is racing up rapidly:
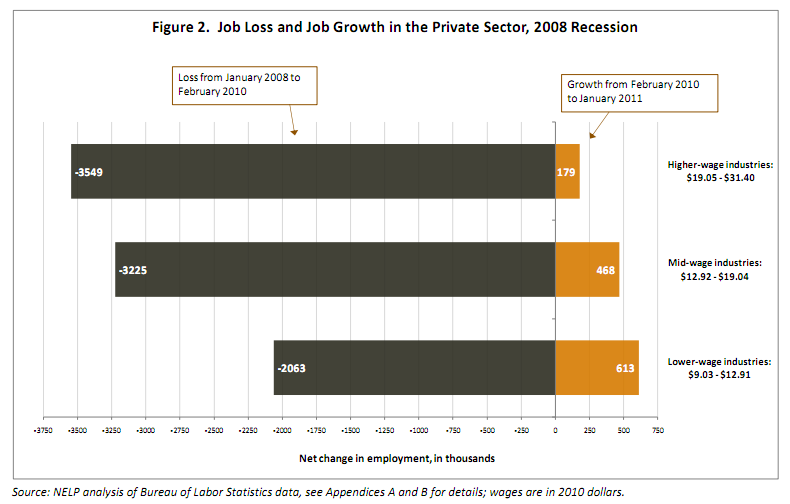
The VIX is now back to levels seen in April when European contagion and debt problems were going viral but also shows a trend that is looking like 2008. Things are more problematic for middle class Americans since the unemployment rate is 9.2 percent and the underemployment rate is much higher, nearly twice the headline rate. What is missed in all the talk of jobs is the fact that many Americans have taken up jobs in lower paying fields and are thus counted as fully employed. This is a dark reality of the new era of low wage capitalism:
Source:Â NELP
This is a very important chart because it tracks jobs lost starting in 2008 and what has been added in the so-called recovery. Over 3.5 million higher wage jobs were lost from January of 2008 to February of 2010. Since that time, only 179,000 higher wage jobs have been added (or 5 percent of what has been lost). Of the 3.2 million jobs lost in the mid-wage industries only 468,000 jobs have been added. Yet the dominant growth comes from the lower-wage sectors. 2 million jobs have been lost but 613,000 have been added. What the chart doesn’t show however is how many of those who lost higher wage jobs are now finding themselves taking jobs in the lower-wage industries. This is simply more evidence showing the crushing blow being leveled at the middle class.
So what are we to make of this market volatility? First, the reality is that most Americans do not own any sizeable amount of stocks to make a difference. The majority of the American public is simply trying to get by with a paycheck from a job. Data from SNAP which tracks food stamp usage shows that 46 million Americans are now receiving food assistance. This is a group that isn’t tracking a hedge fund portfolio but is simply trying to get by to the next day. It is amazing how many fellow Americans are one day away from being put out on the street with no food. Yet the system is still eagerly trying to bailout more of the banking giants as if they needed more support. The volatility is coming from a financial system that simply does not reflect the interests and the success of the economy. Just remember the example of the billionaire hedge fund manager that made billions by betting on the failure of Americans and housing. At some point these individuals begin hoping that demise is imminent and may even create securities that exacerbate this problem. Their profits are interlinked with the failures in the real economy.
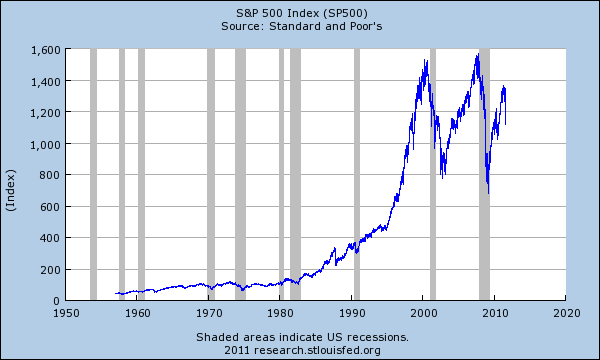
Bubbles are not normal but if we look at the S&P 500 over the last couple of decades we get a story of two massive bubbles:
It doesn’t take a charting genius to figure out where the volatility entered the system. If we do not reform the banking system why are we to expect anything different? This crushing volatility that brings back memories of 2008 should come as no surprise. In fact, we should expect the same bailout talk of quantitative easing part three from the Federal Reserve and more politicians helping out their banking colleagues. Most people know the script at this point and market volatility is not a good sign for the majority of Americans.
If you enjoyed this post click here to subscribe to a complete feed and stay up to date with today’s challenging market!
1 Comments on this post
Trackbacks
-
d down said:
1. if dealers sell coins, what do they invest paper receipts in?
2. “EU is broke” web says. ‘bail out funds disapper…” to WHERE?
3. A. Lees, UBS “l. debt must clear, 2. capital must be
properly allocated.” how, by tax breaks? if these dont work
will 1930 ‘s NRA< AAA, contracts by US to build roads work?
whats left….RUs style 1928-39 'diktates." to put capital to work?August 15th, 2011 at 1:20 pm


 If you enjoyed this post click here to subscribe to a complete feed and stay up to date with today’s challenging market!