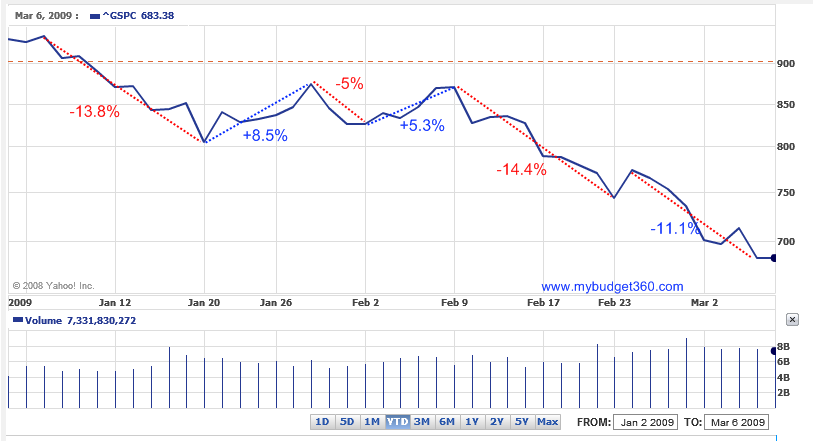
Stock Market Volatility Back Again: The S&P 500 has had 3 Major 10+ Percent Moves to Downside Already in 2009: -13.8%, -14.4%, and -11.1%. Market Volatility a Sign of Unhealthy Markets, and We’ve only gone through 2 Full Months.
- 0 Comments
The S&P 500 has lost 26% of its value in 2009 and we are only in March. This comes on the back of the S&P 500 losing 36% of its value in 2008. Market volatility is typically a sign of major uncertainty and while we did have a slightly stable period once we bounced off the November previous lows, it looks like we are now back in 2008 volatility territory. Keep in mind that we are only a few points away from matching 2008 declines and we’ve only gone through 2 full months of the year. And as many are predicting, we have yet to see commercial real estate really come down or the market changing prospect of nationalization of a few major banks.
The FDIC has now gone down the path which we mentioned a few months ago that their pittance for an insurance fund was going to be wiped out soon. I think most of us knew this was only a matter of time but I thought that certainly we would get through the first half of the year and my initial assessment was that CRE would be the next leg down to bring the market lower.
The S&P 500 is back on a volatile roller coaster resembling 2008. So far this year we have had already 3, that is right, 3 movements where the market has declined by over 10 percent:
Normally you would see such drastic moves over a year or certainly a few years. But these are not ordinary times. We have also seen a few major moves up but these have been tiny compared to the major downward trends of 13.8%, 14.4%, and 11.1%. These are significant movements and the more startling thing is much of this is occurring while the U.S. Treasury and Federal Reserve are allocating trillions to bailout banks and troubled institutions.
Another indicator showing that this selling is not overdone is look at the VIX:
Just take a look at the volatility in the options markets in October and November of 2008. The VIX shot over 90 and remained high for a few months. So this was a solid indicator that much of the selling at this time was overdone for the moment. However, look at the recent figures. We have had a much larger percentage drop in January and February of 2009 yet the VIX is relatively stable.  What does this mean? Much of the selling is more orderly even though it is giving the appearance of volatility. In October and November of 2008 the volatility was both due to major stresses on the market but also traders on both sides placing their bets. In 2009 much of the volatility is people simply walking away from the market or lack of sellers. And certainly this has to do with the fact that many option premiums are now expensive keeping the VIX light years away from the 90 we had back in 2008.
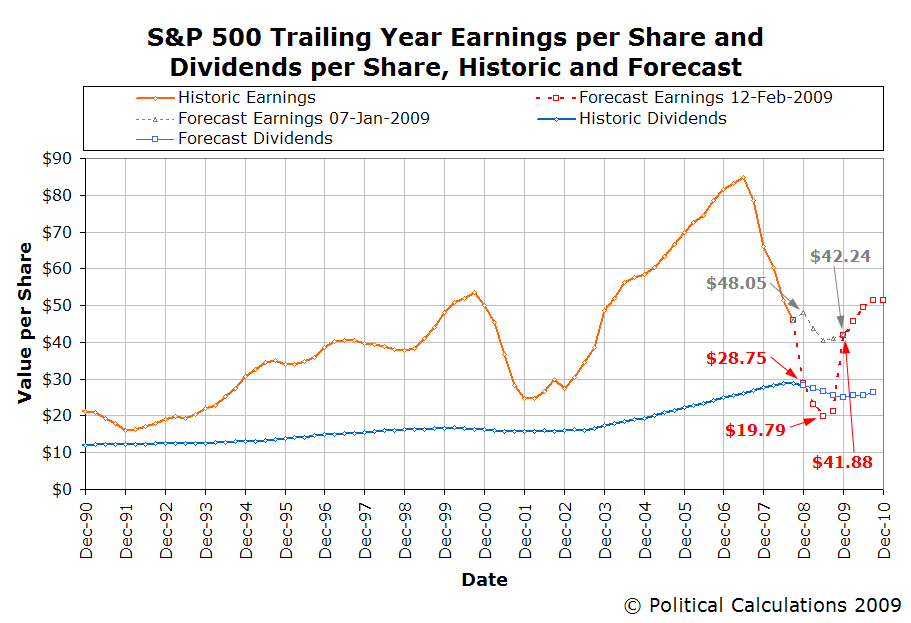
So what can we take from this? Markets are still highly volatile and the S&P 500 is now seeing negative earnings for the first time:
Source:Â Political Calculations
What the chart shows us is that even though P/E may look affordable, many of the S&P 500 companies will once again be reporting losses when the first quarter results are tallied starting in April of 2009. If anything, losses may be more significant than the 4th quarter of 2008 given what has been occurring. So it is premature to assume that the stock market is cheap because if many of the companies are reporting declining revenues and all signs point to this, it may be much too early to jump in at this point. Some recent estimates put the bottom of the S&P 500 at 600 although we are already there without factoring major CRE losses and further bank writedowns. I would estimate that the bottom is somewhere around 400 points.
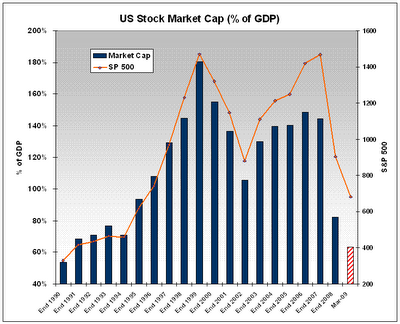
And many are seeing a bottom simply because so much wealth has evaporated from the markets:
Source:Â Sudden Debt
Market cap of the US stock market as a percent of GDP is now back to 1990 levels being at 63%. A drop of over $15 trillion to approximately $7 trillion. That is indeed market volatility.
If you enjoyed this post click here to subscribe to a complete feed and stay up to date with today’s challenging market!


 If you enjoyed this post click here to subscribe to a complete feed and stay up to date with today’s challenging market!